Monitor FerretDB Performance using Coroot

Effective real-time monitoring is a critical aspect of any infrastructure. Coroot is an open source observability platform that can provide real-time monitoring and visibility into a FerretDB setup.
App developers can quickly troubleshoot issues without necessarily becoming experts in infrastructure operations and management.
If you're just finding out about FerretDB, it's the truly open source document database that provides MongoDB compatibility with Postgres as the backend. With Coroot, you can get visibility into your entire system in a matter of minutes.
In this blog post, you'll learn about Coroot and how it can help you monitor and get better visibility into your FerretDB instance.
Coroot observability for FerretDB
Imagine a scenario where your FerretDB instance is deployed as a Docker container along with other components and services for your application. Observability into all critical areas of the system in as little time is vital. However, it can be challenging to monitor all components and services effectively. You need to instrument all parts of your application, including the FerretDB, PostgreSQL, and other services and orchestrators connected to it. That could be resource-intensive, time-consuming, and even costly to configure, log, and maintain.
With Coroot, you can visualize every aspect of your entire setup. That includes all its components, including your applications and their subsystems, databases, and, most importantly, how they all communicate.
Coroot heavily relies on eBPF, a technology that enhances observability and monitoring by eliminating the need to instrument application code manually. Custom programs can run directly within the Linux kernel without changing kernel source code or loading additional kernel modules. You get deeper and more extensive information on system calls, network functions, and security issues – just better observability.
Let's look at an example with Prometheus and Grafana.
Monitoring FerretDB with Prometheus and Grafana
A typical approach to monitoring your FerretDB instances is through Prometheus and Grafana. You can deploy Prometheus to scrape metrics from FerretDB and visualize them through Grafana dashboards. That process involves:
-
First, you need to expose the default port for FerretDB metrics in Prometheus format on http://127.0.0.1:8088/debug/metrics. There's no need for an external exporter.
-
Next, you need to set up Prometheus for metrics collection
-
Then go ahead to design all the dashboards and panels to visualize.
The image below shows a typical dashboard design using Grafana to display some of the metrics, including total client requests and responses, client connection durations, memory usage, CPU usage, and overall instance health.
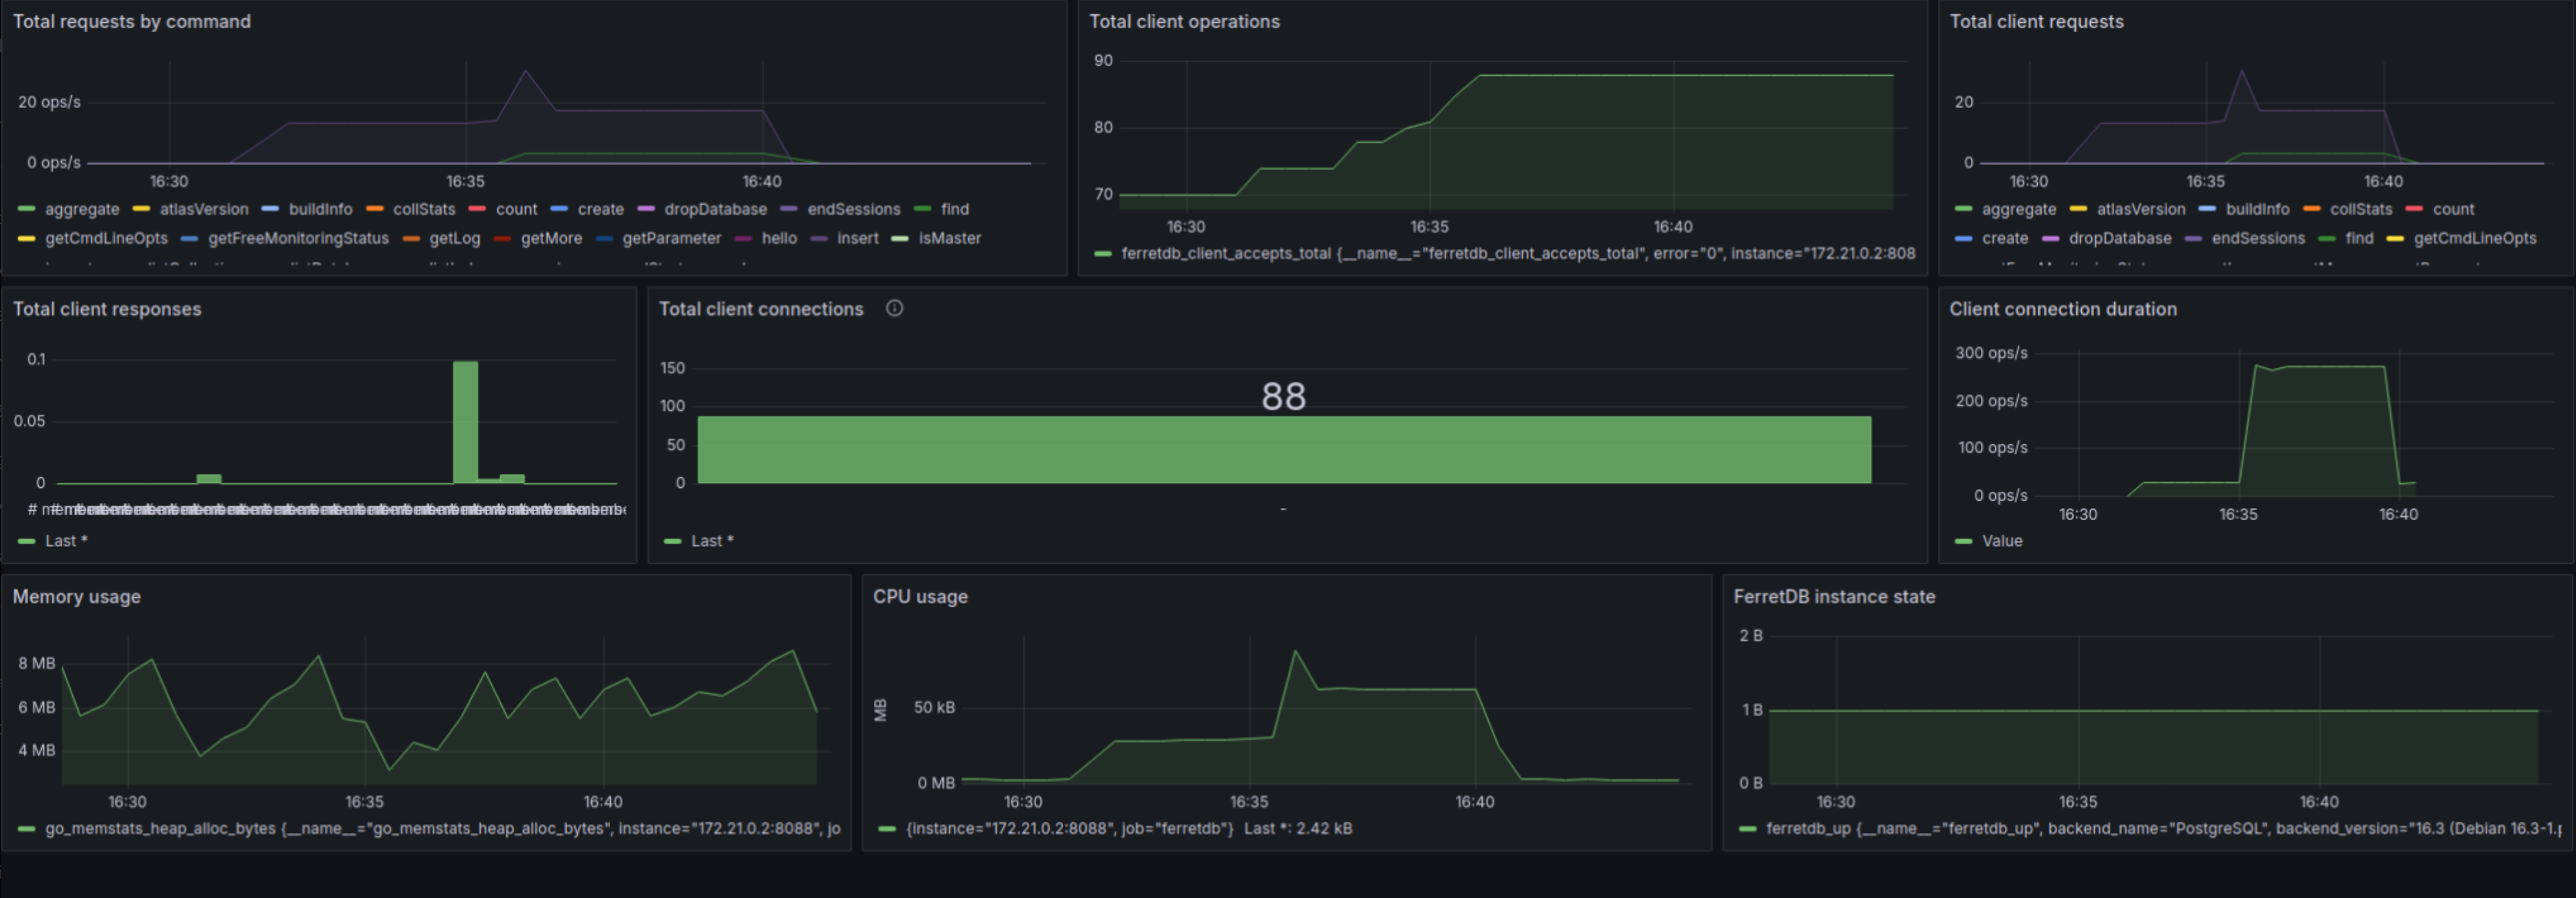
Although, these dashboards provide valuable insights into the database's performance, workload distribution, and resource utilization, setting it up can be quite labor-intensive. The process is time-consuming and requires a deep knowledge of both tools to accurately capture and visualize relevant metrics. Besides, each time you start a new service you'll have to repeat the setup process all over again. This approach also misses out on some critical insights that an eBPF tool like Coroot provides. For instance, detailed network performance, specific per-process resource usage, and dynamic tracing of function calls are not natively captured. Coroot offers real-time, low-overhead monitoring directly from the kernel. eBPF provides granular visibility into system and application behavior, including precise CPU usage, memory allocation patterns, and detailed latency breakdowns.
Setting up Coroot for FerretDB monitoring
Refer to the Coroot documentation to set up Coroot and all its components using Docker or via Helm.
In this guide, we will set up Coroot to monitor our FerretDB instance. If you are yet to setup FerretDB, see the FerretDB Docker installation guide.
Deploy Coroot with the following command:
curl -fsS https://raw.githubusercontent.com/coroot/coroot/main/deploy/docker-compose.yaml | docker compose -f - up -d
Since Coroot is deployed locally, you can access it at http://localhost:8080/.
Monitor FerretDB performance with Coroot
To actually monitor and resolve any potential issue with any of these, you need all the relevant information at your fingertips. Using Coroot, you can focus on any app by viewing the dashboards automatically generated for each application. And unlike the Grafana board from earlier where we have to create the dashboards and do not get any application metrics, Coroot lets you see the entire system in detail, so there's nothing to miss.
The Coroot dashboard provides the full details on all components including the number of client connections.
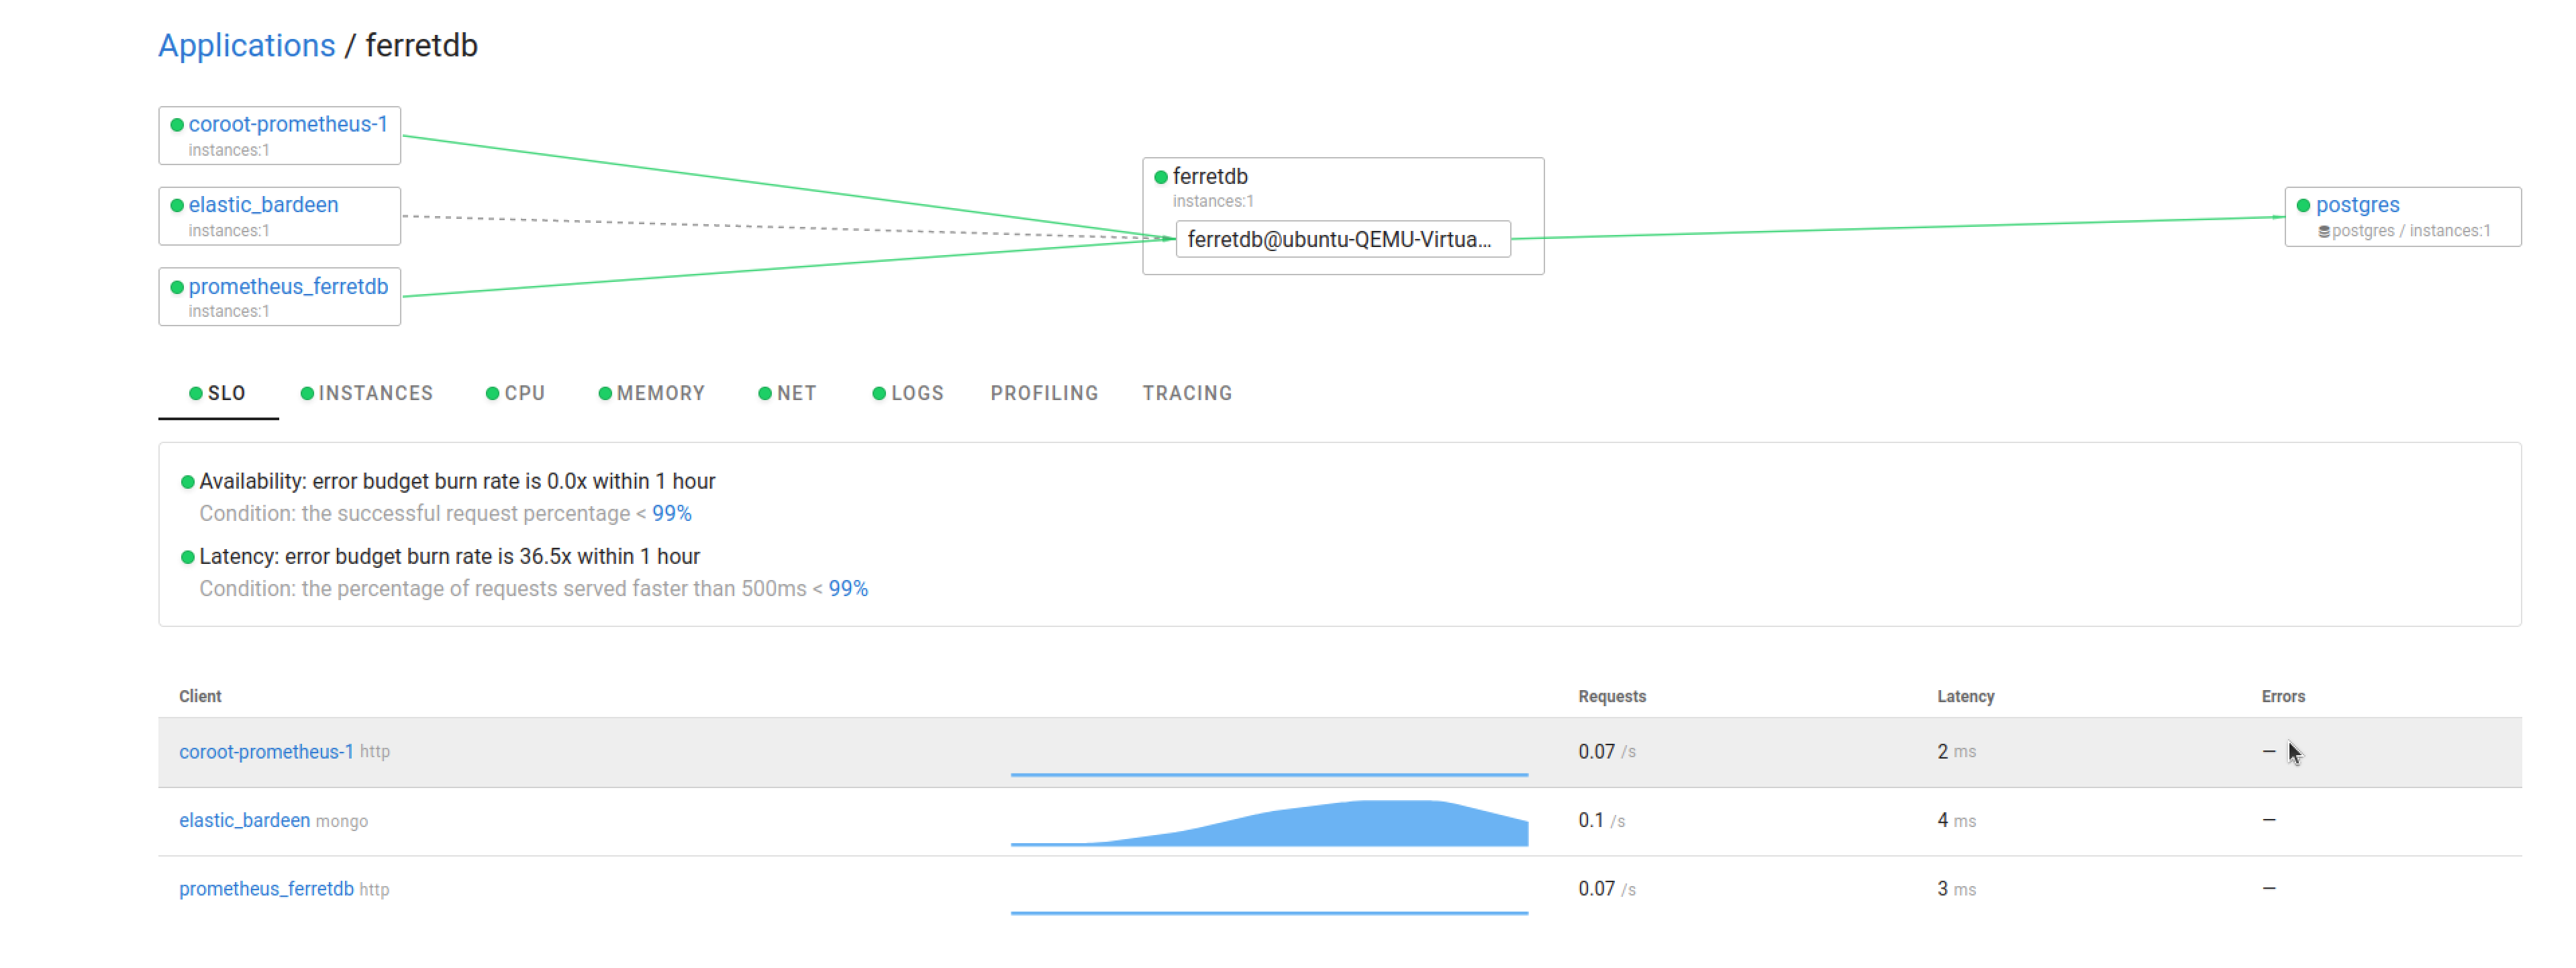
From the image above, you can see the client connections to the FerretDB instance.
It shows a client instance elastic_bardeen and 2 Prometheus instances scraping the exposed FerretDB metrics, and all requests then forwarded to postgres.
You can also see the latency/error rate (4ms) and request per second(RPS) (0.1/s) of the client application to FerretDB.
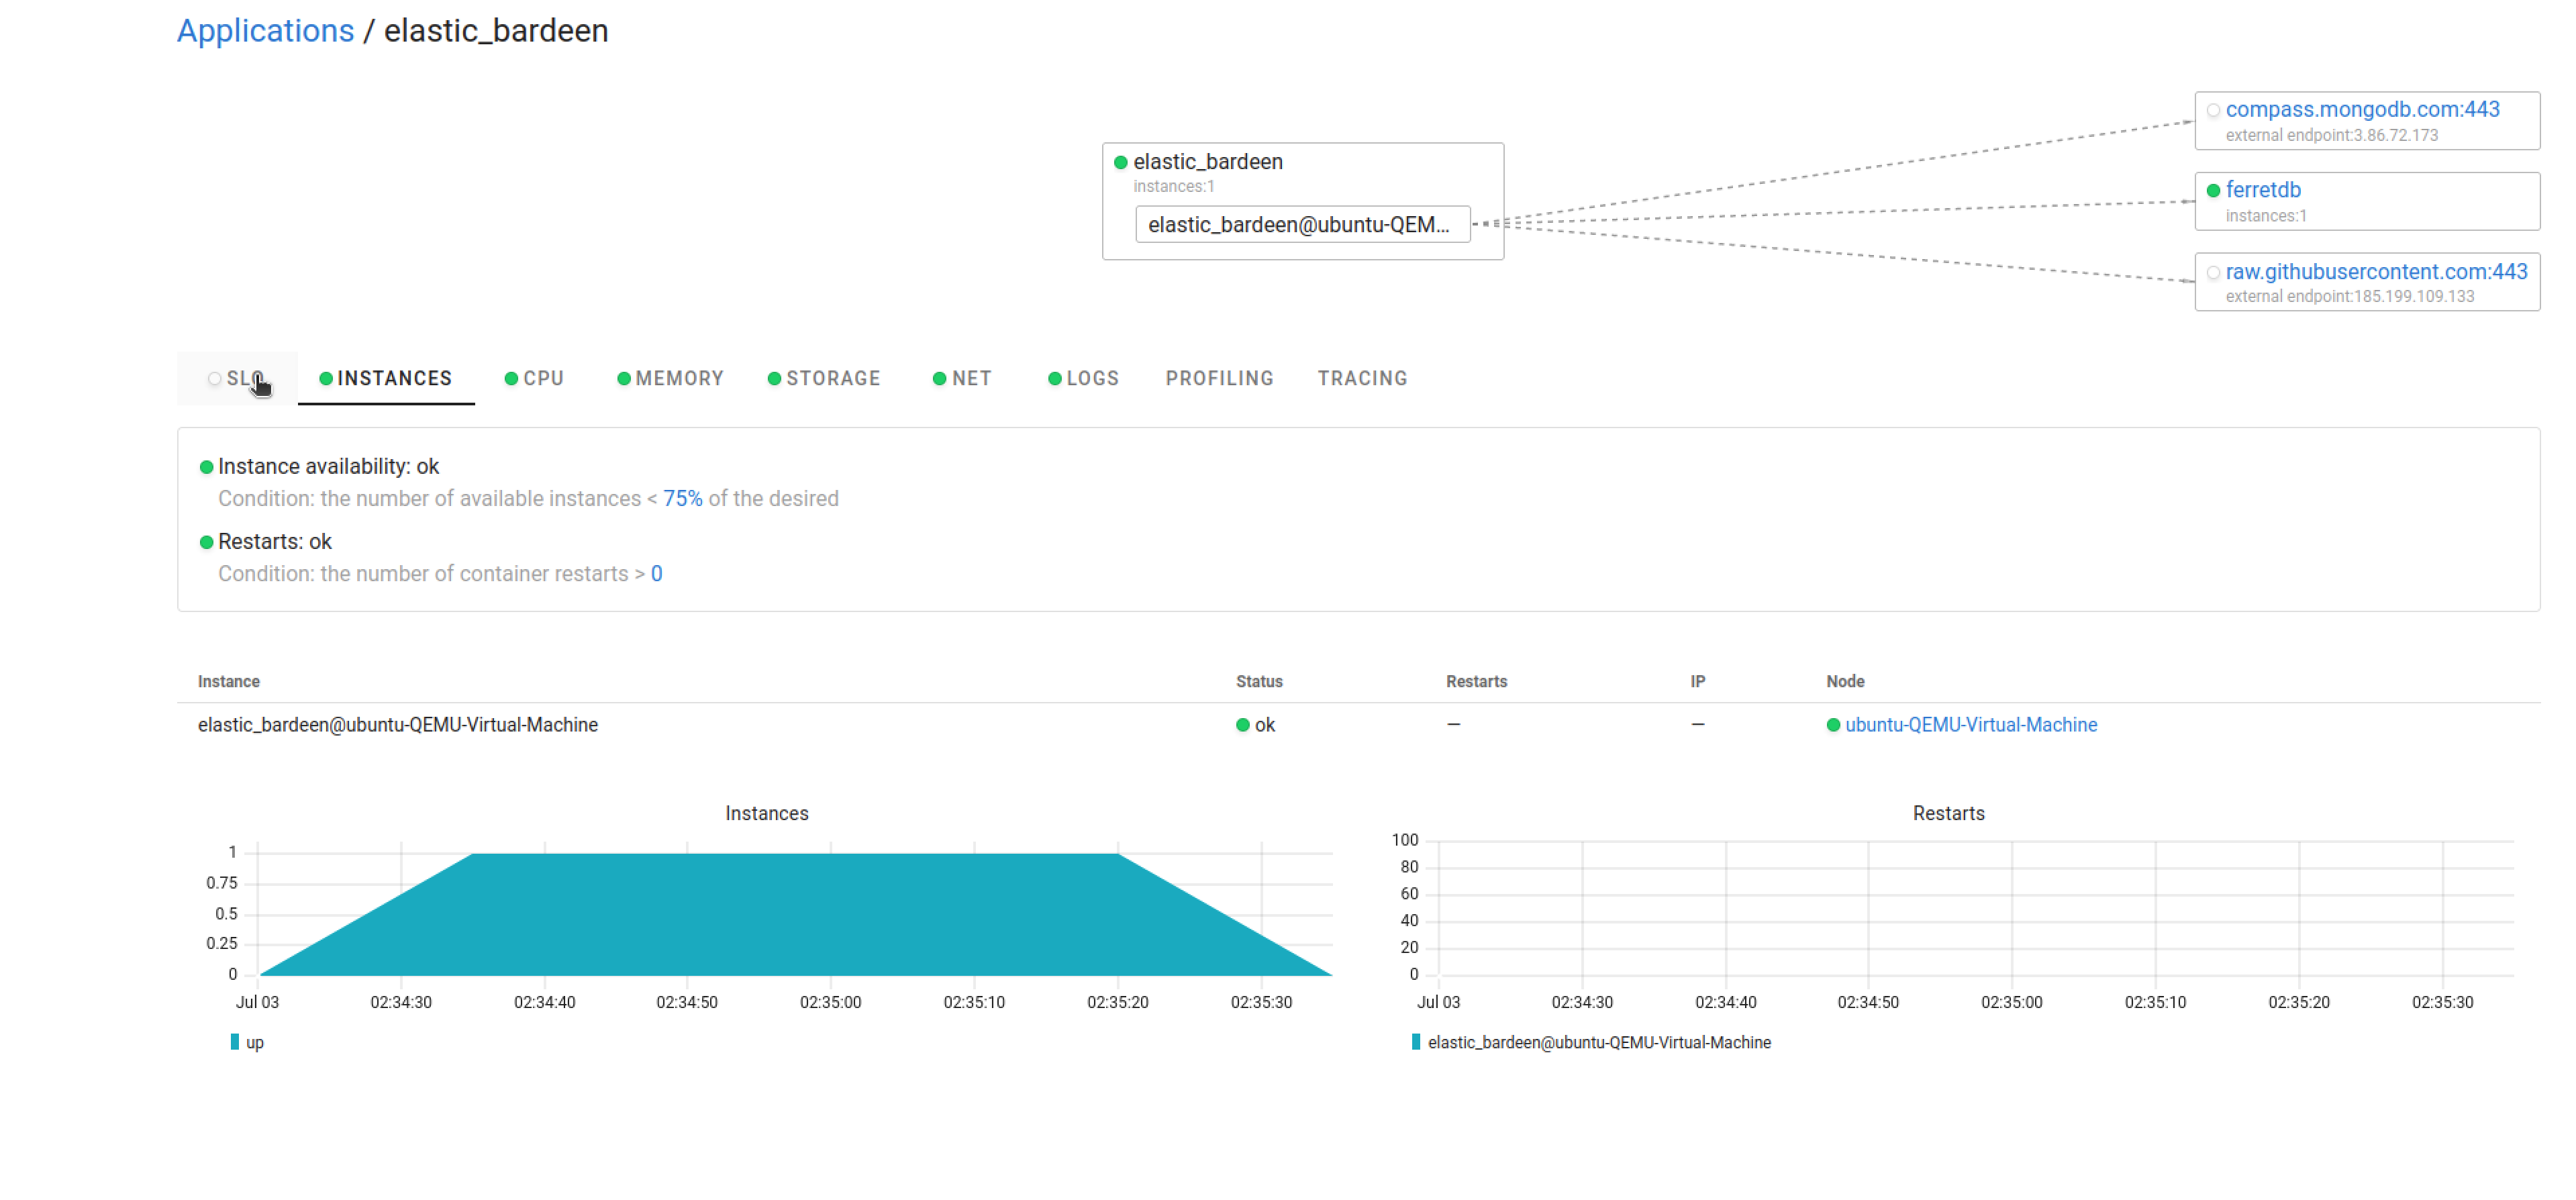
For instance, let's peer into the client application elastic_bardeen.
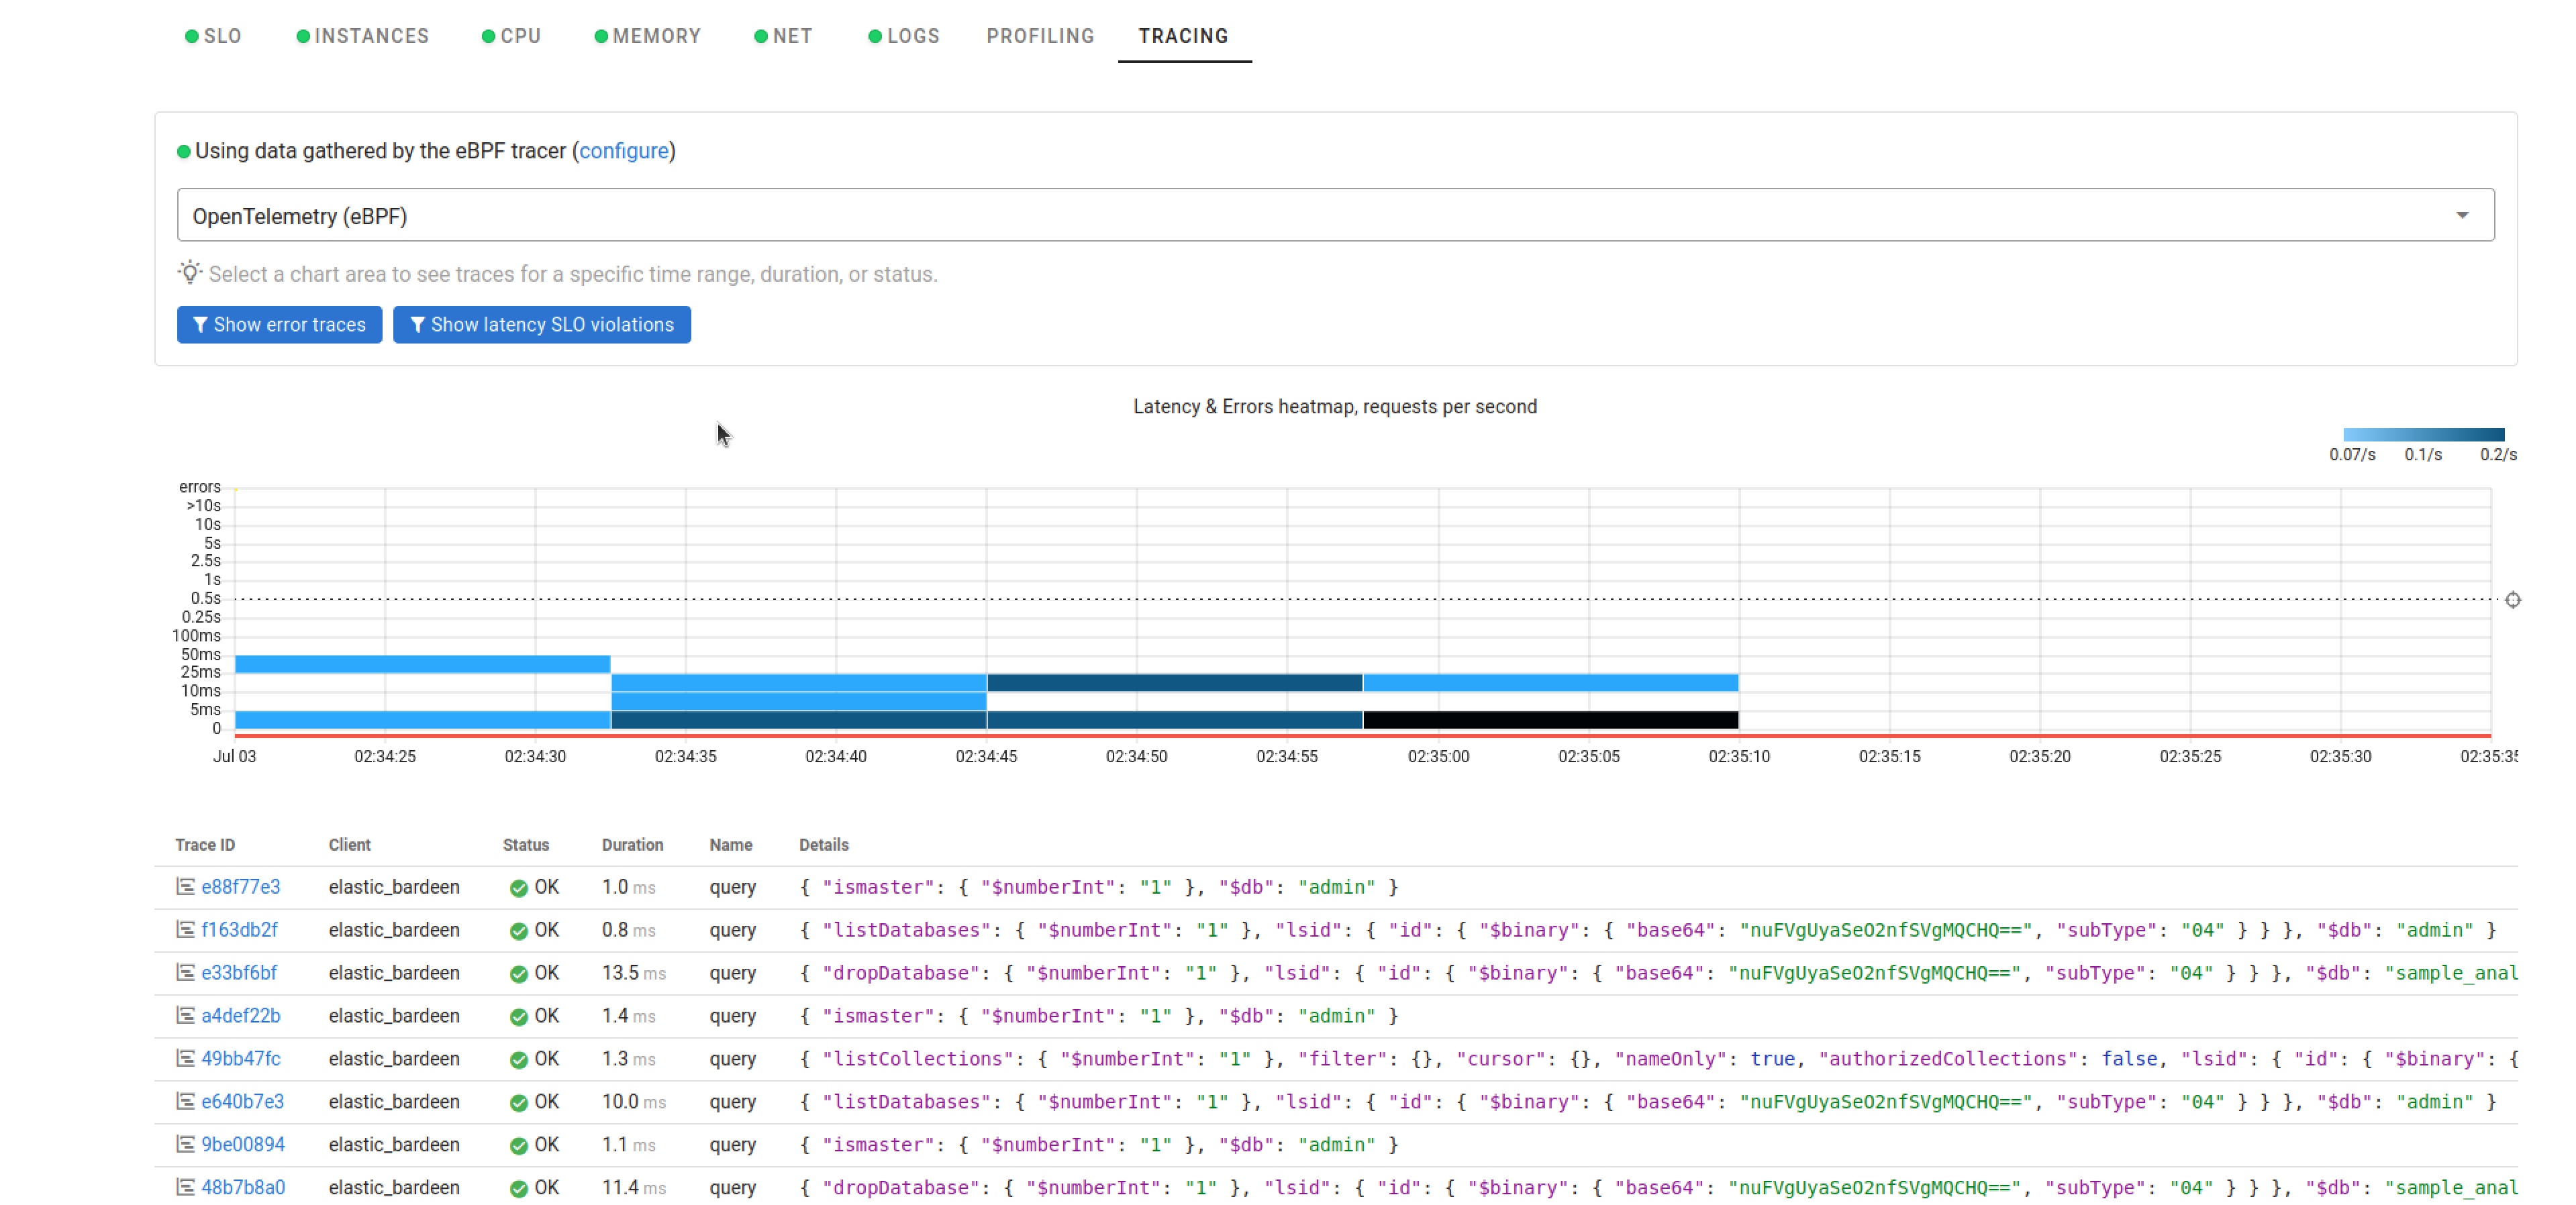
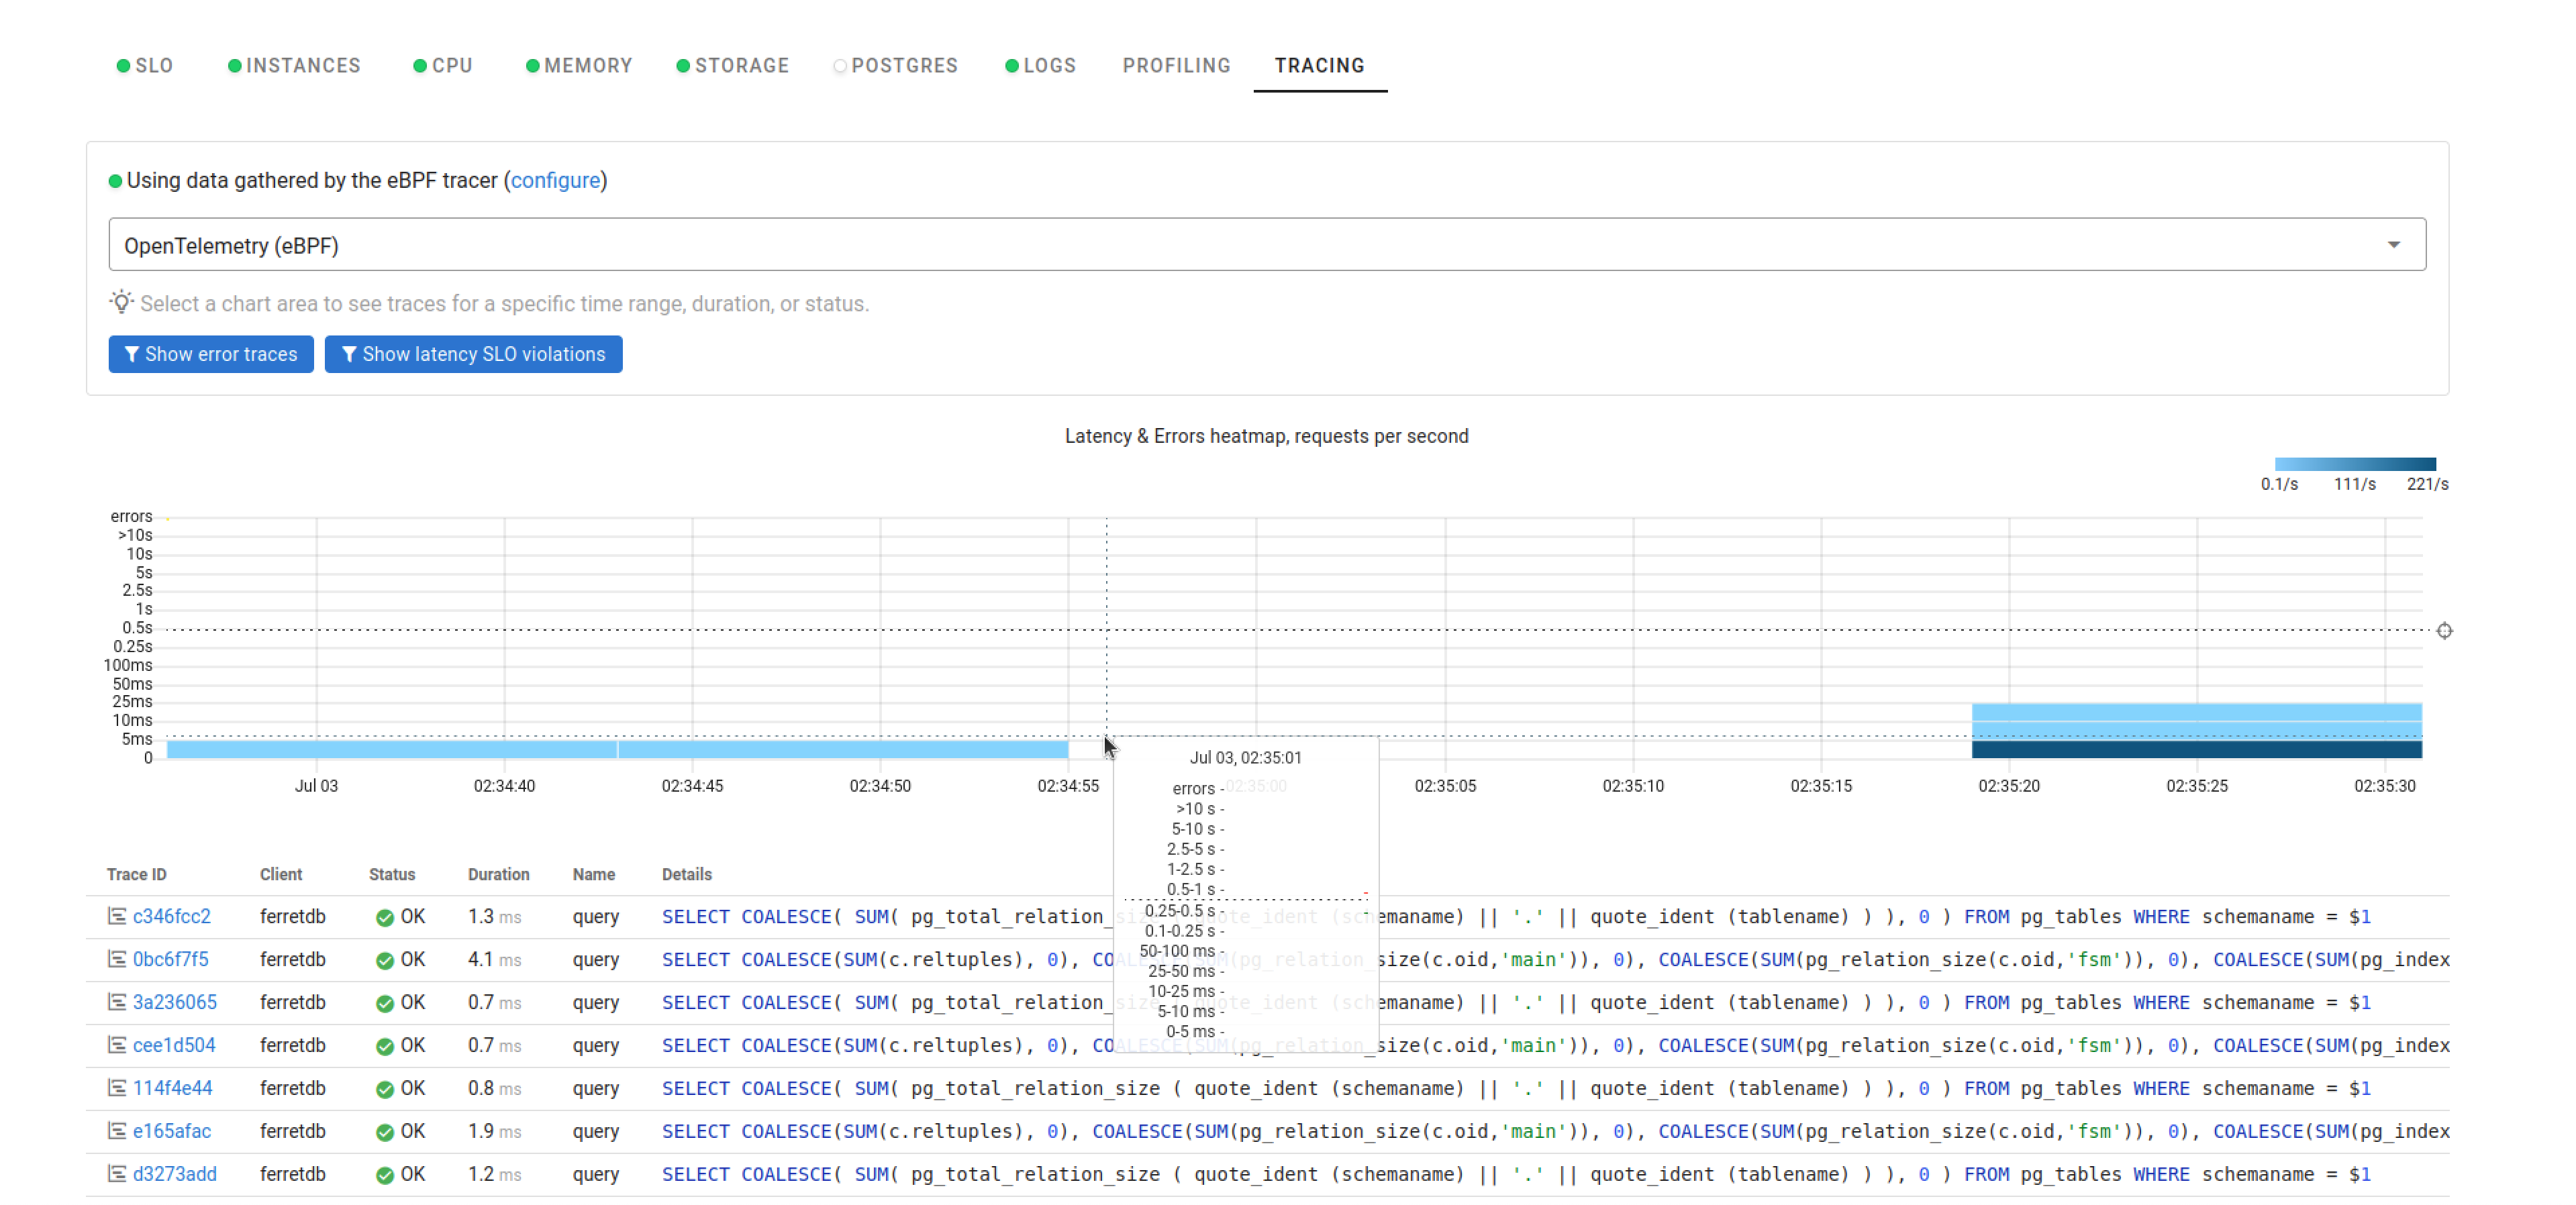
Coroot also provides distributed tracing to help you find out why some of your requests are taking long to execute or failing. In the image below, you can see the comprehensive view of the request path, latency, and errors, identify performance bottlenecks, and trace the root cause of issues.
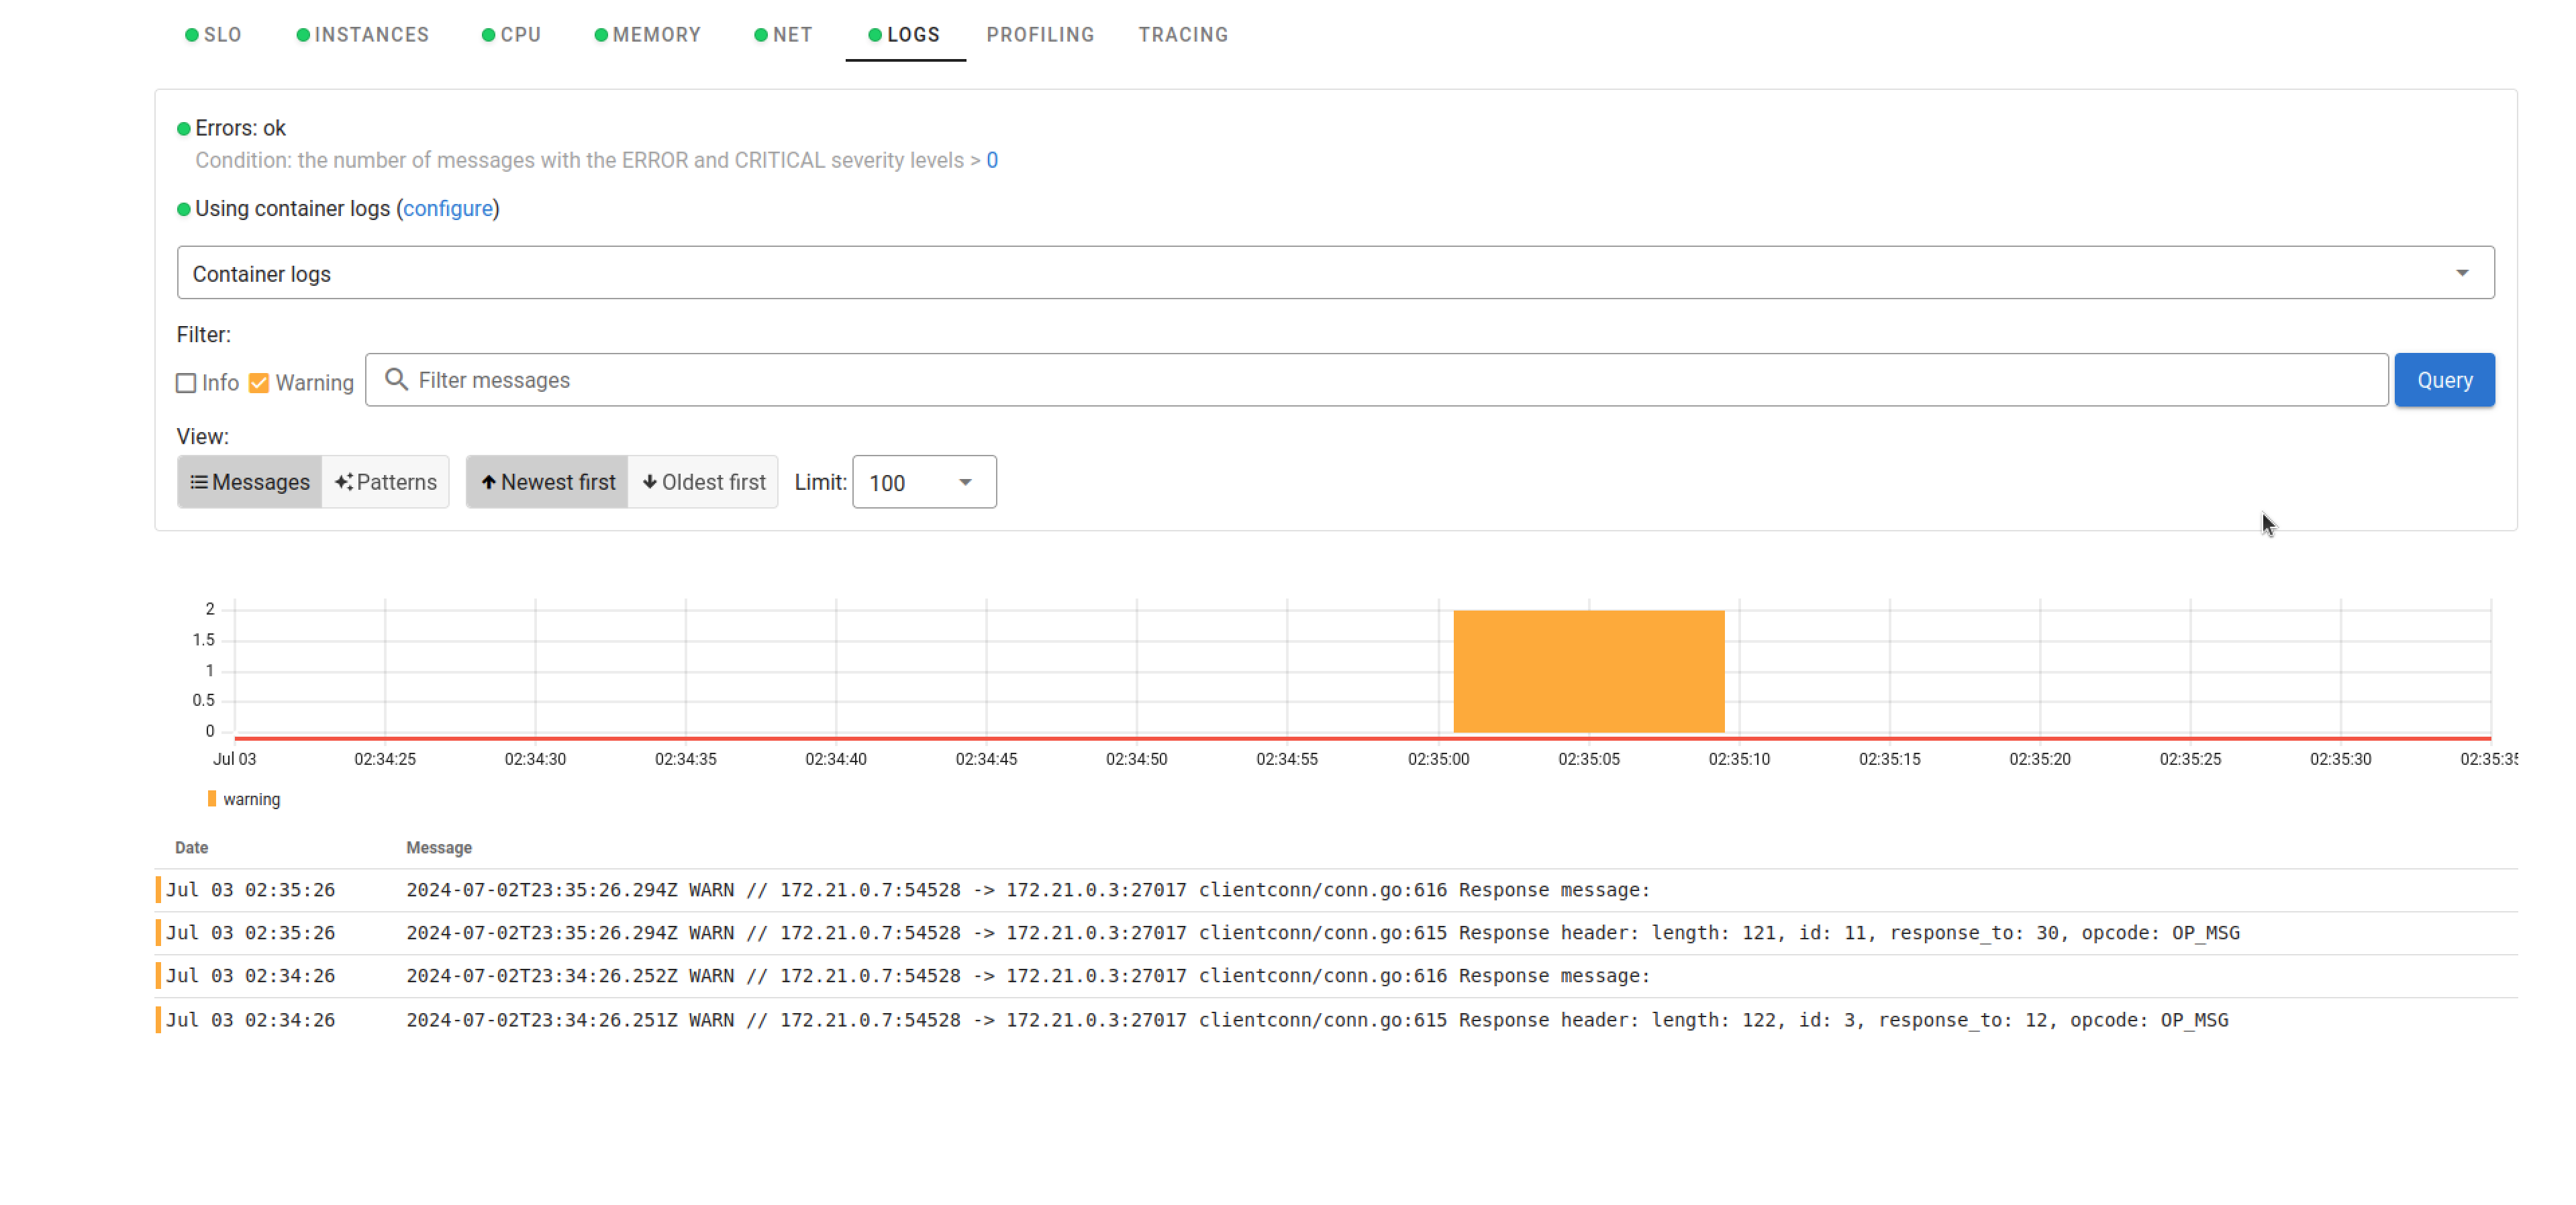
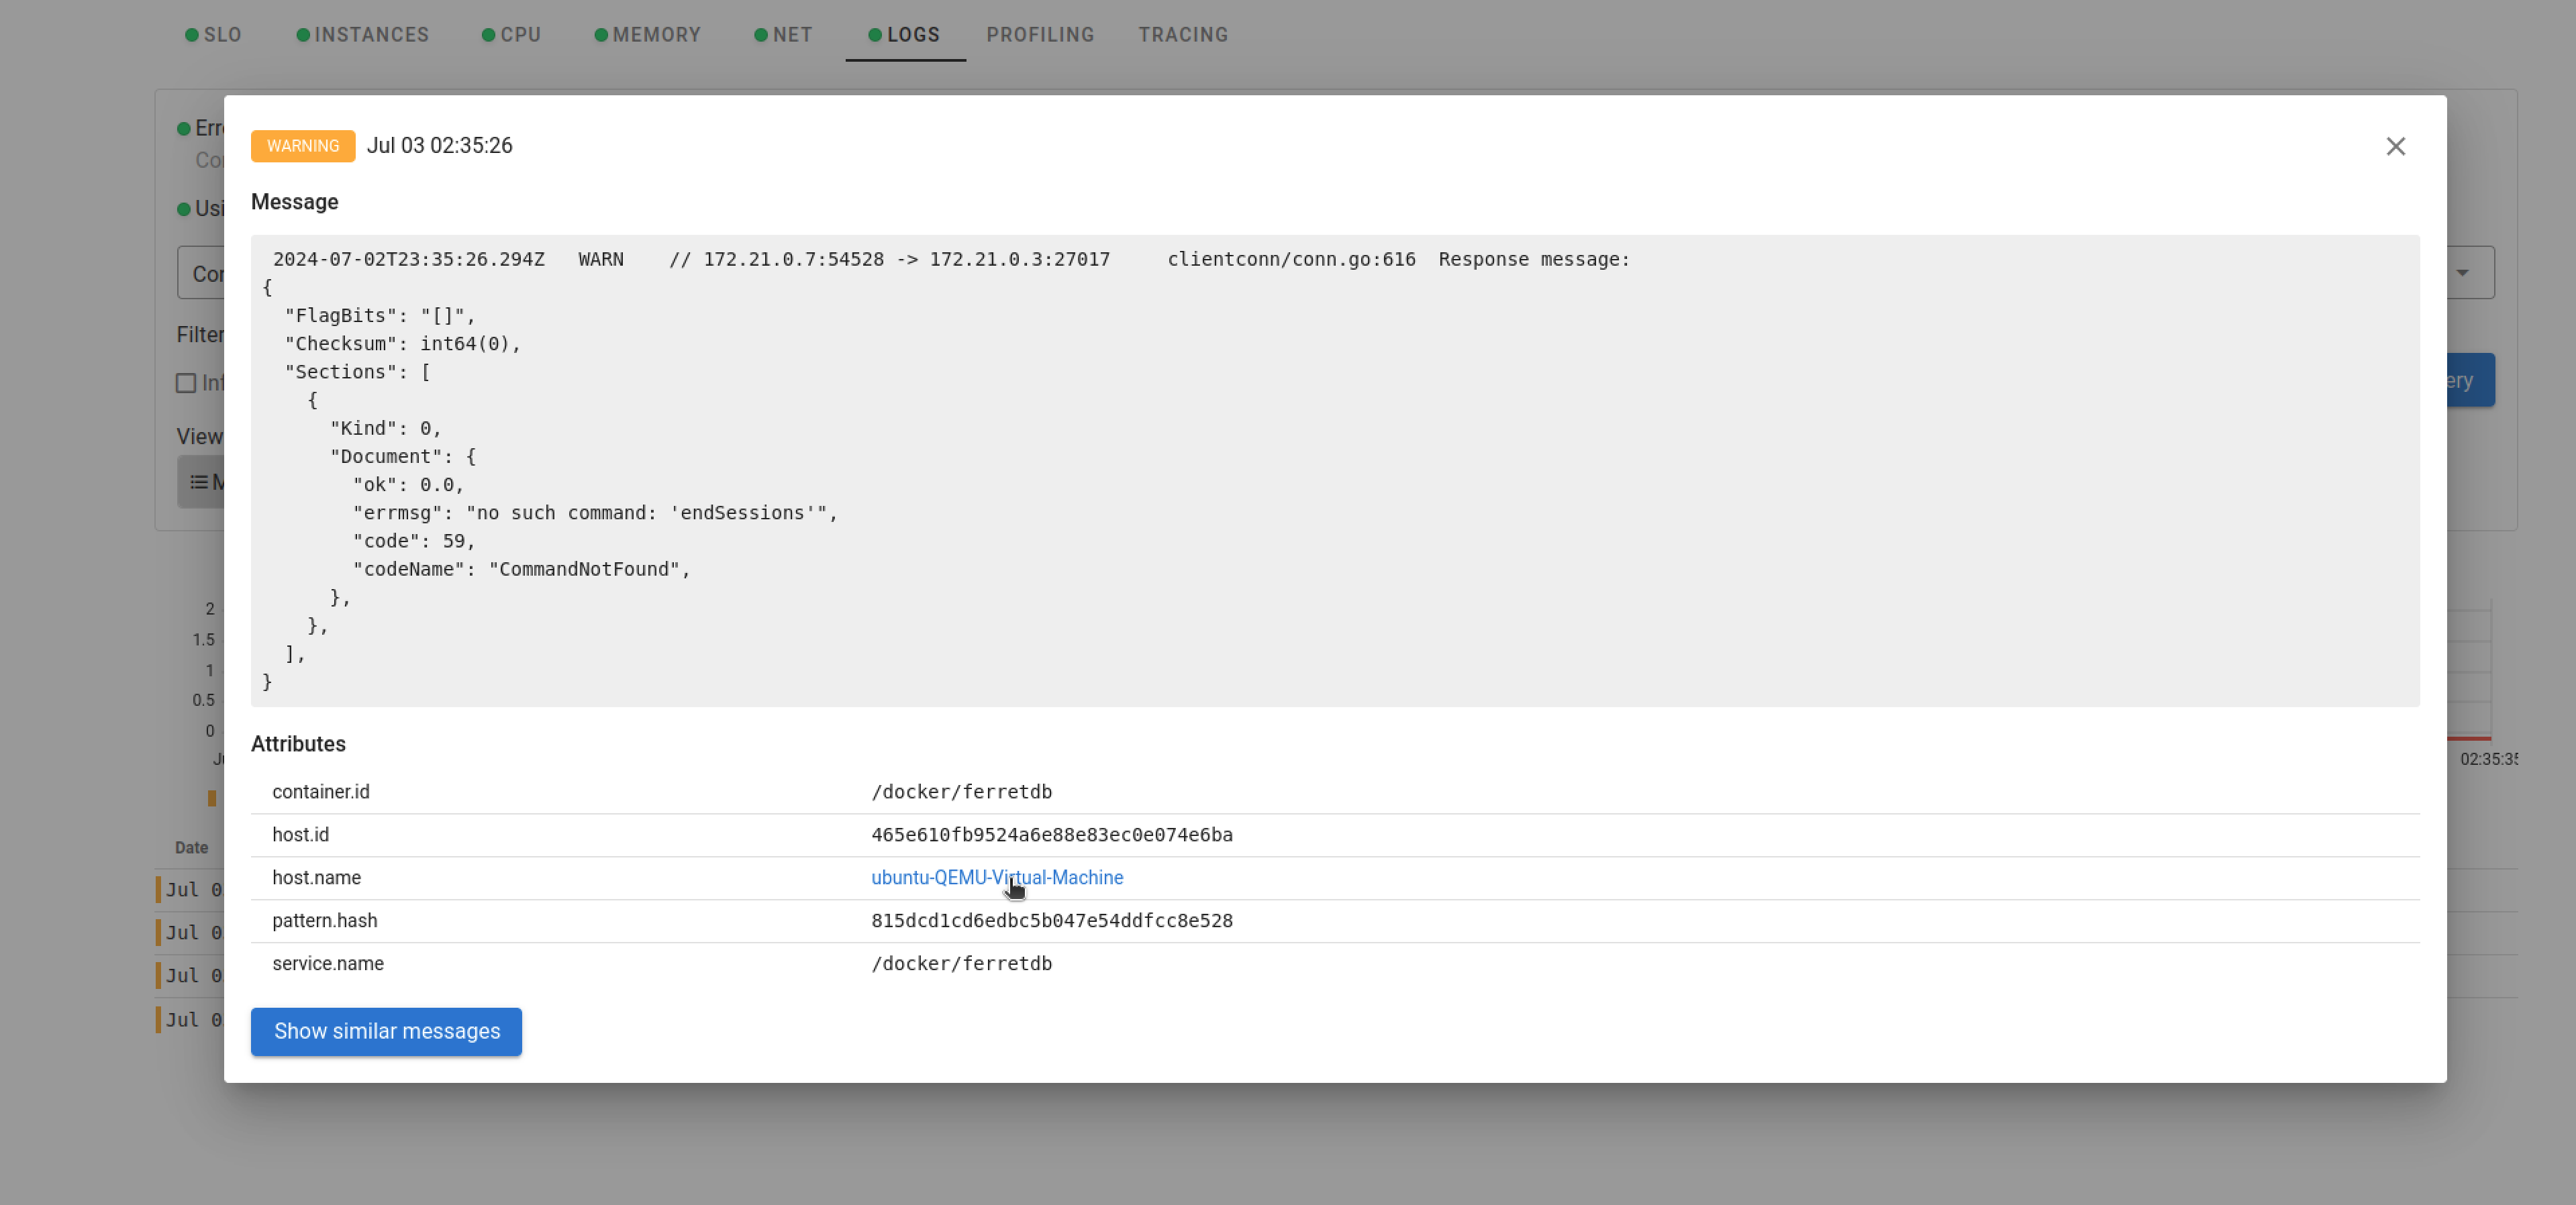
Even at that, Coroot's log monitoring metrics offer a little more insight and quick check to identity recurring patterns and message severity. For instance, the images below show some warning response regarding the operations that were performed.
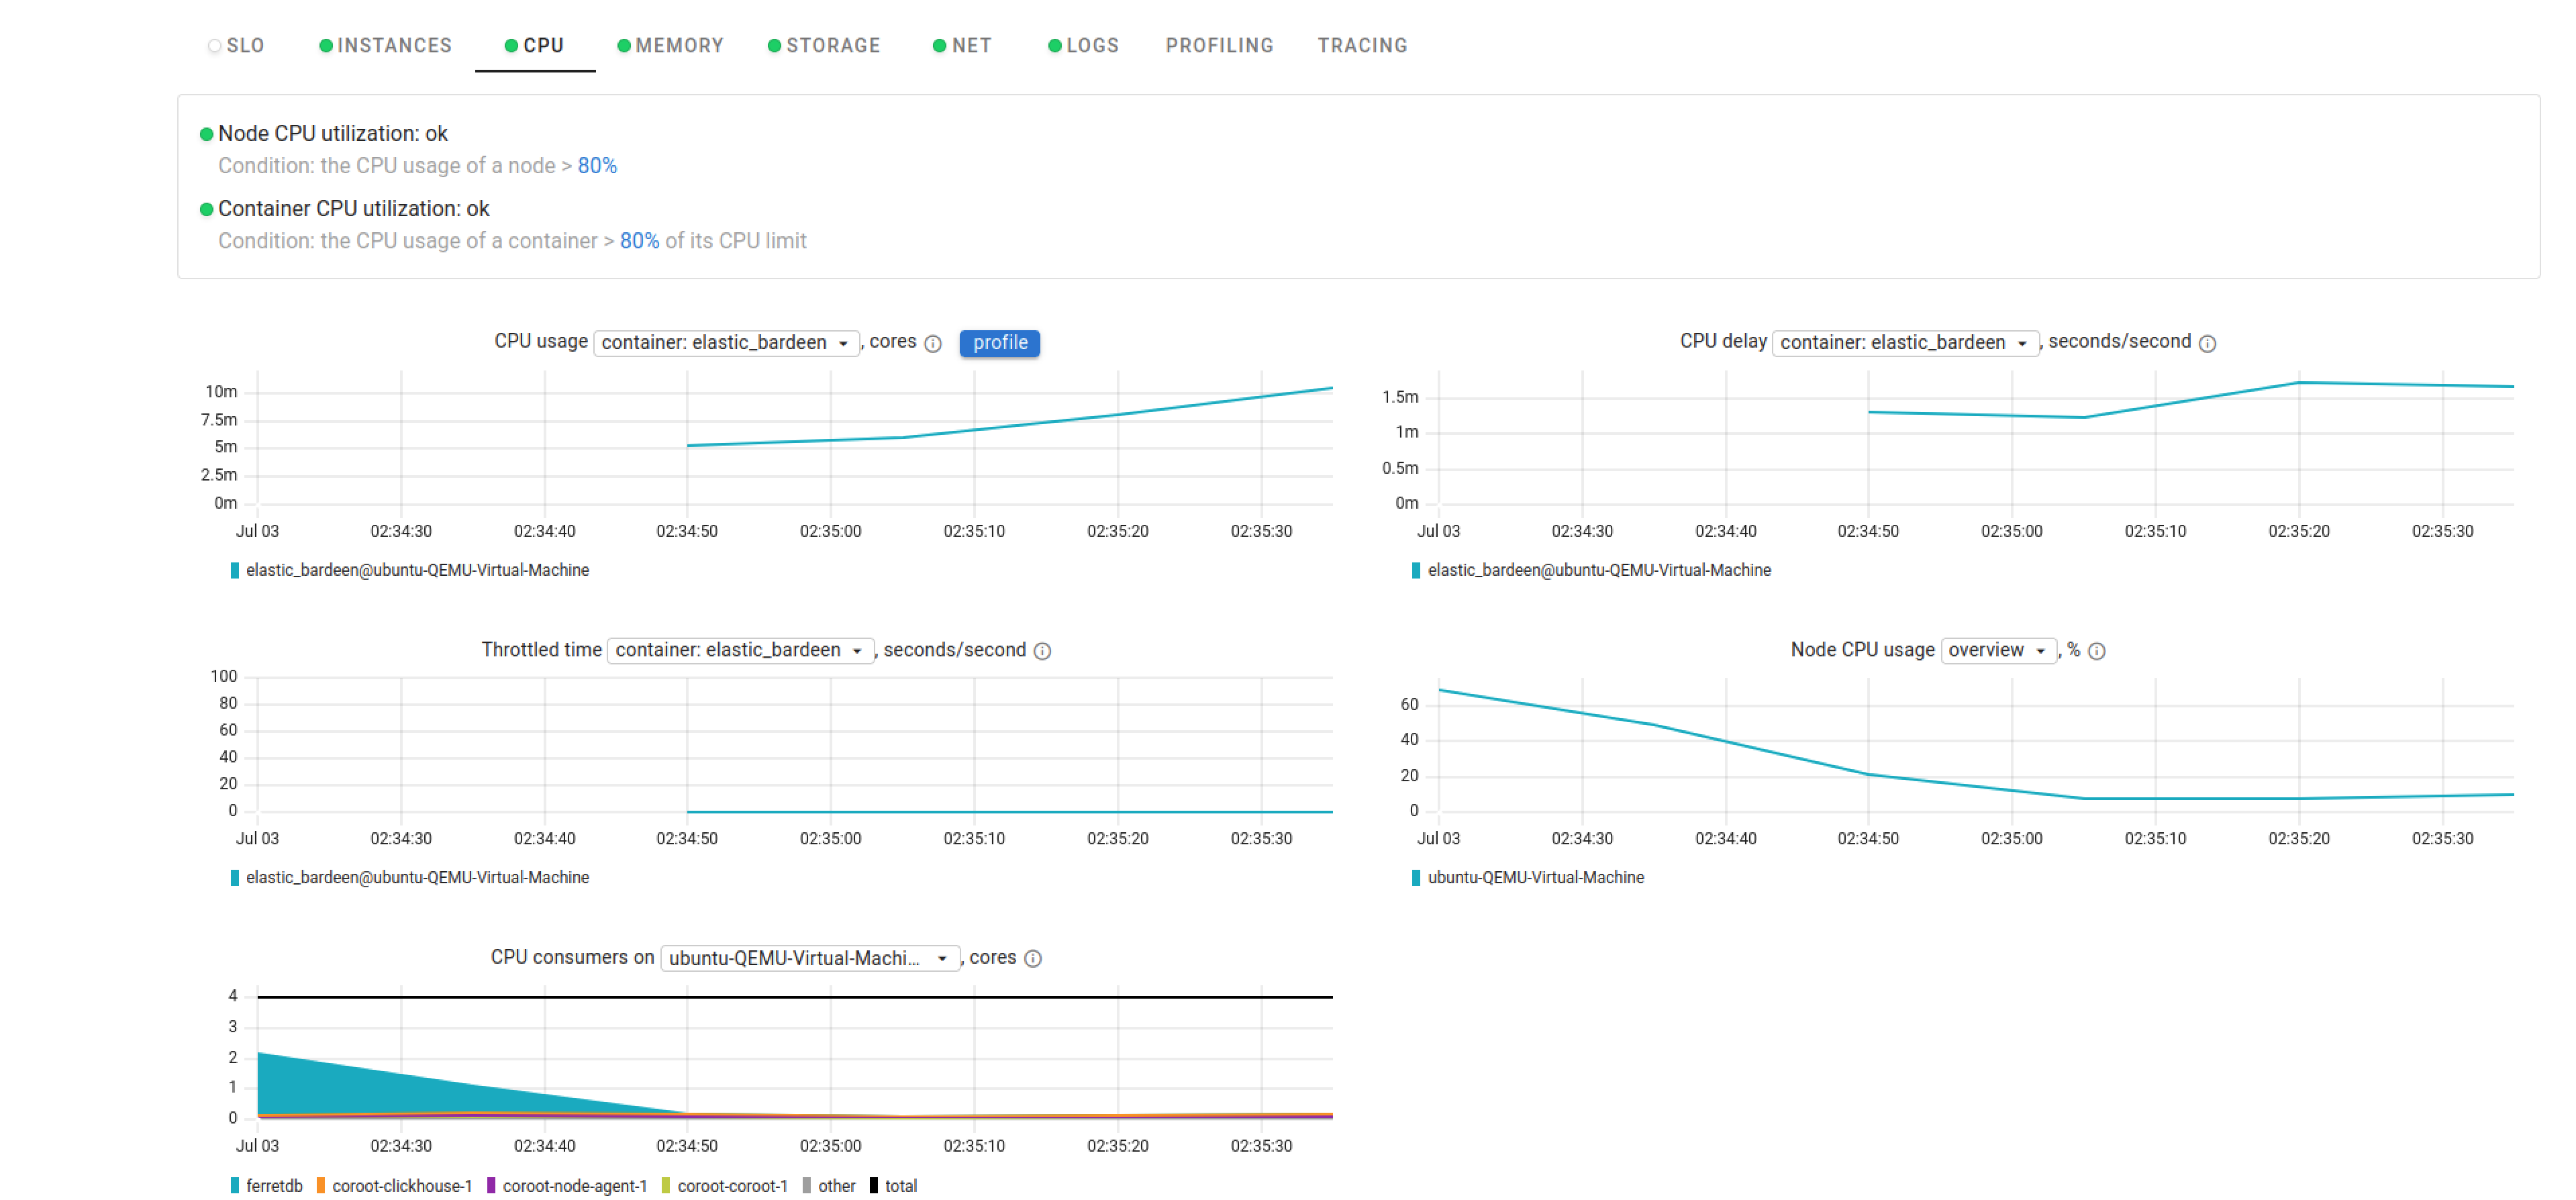
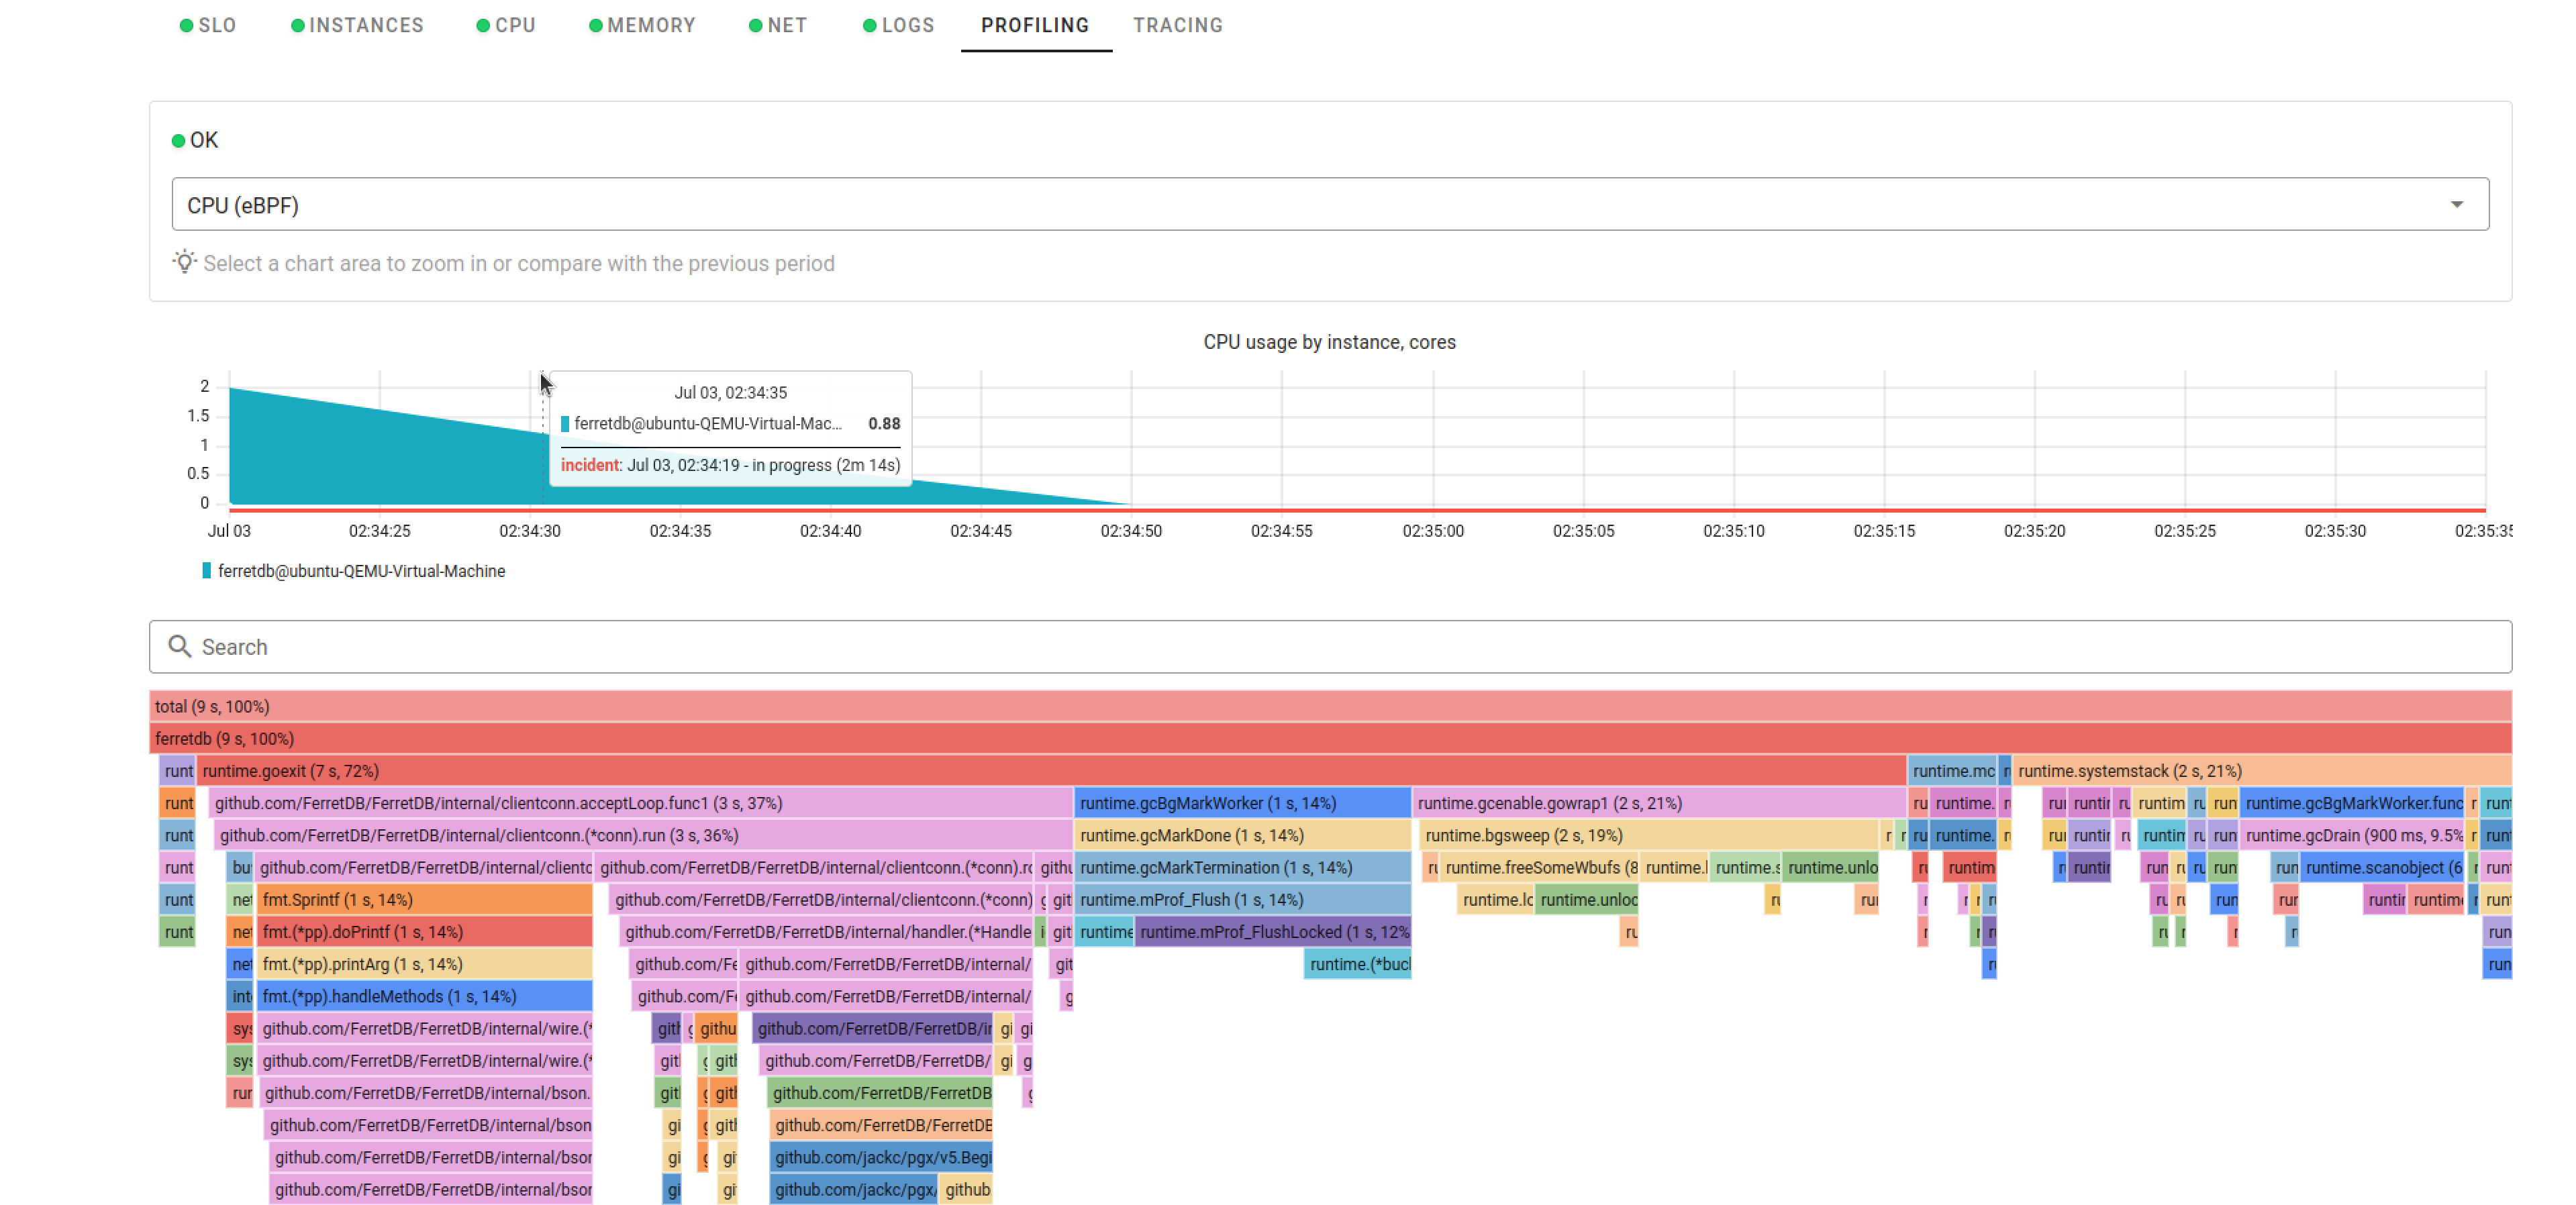
You can look into the changes in CPU and memory usage down to the line of code via Coroot's continuous profiling. That should help you quickly pinpoint any performance bottlenecks, optimize your application's resource usage, and deliver a more reliable and faster service.
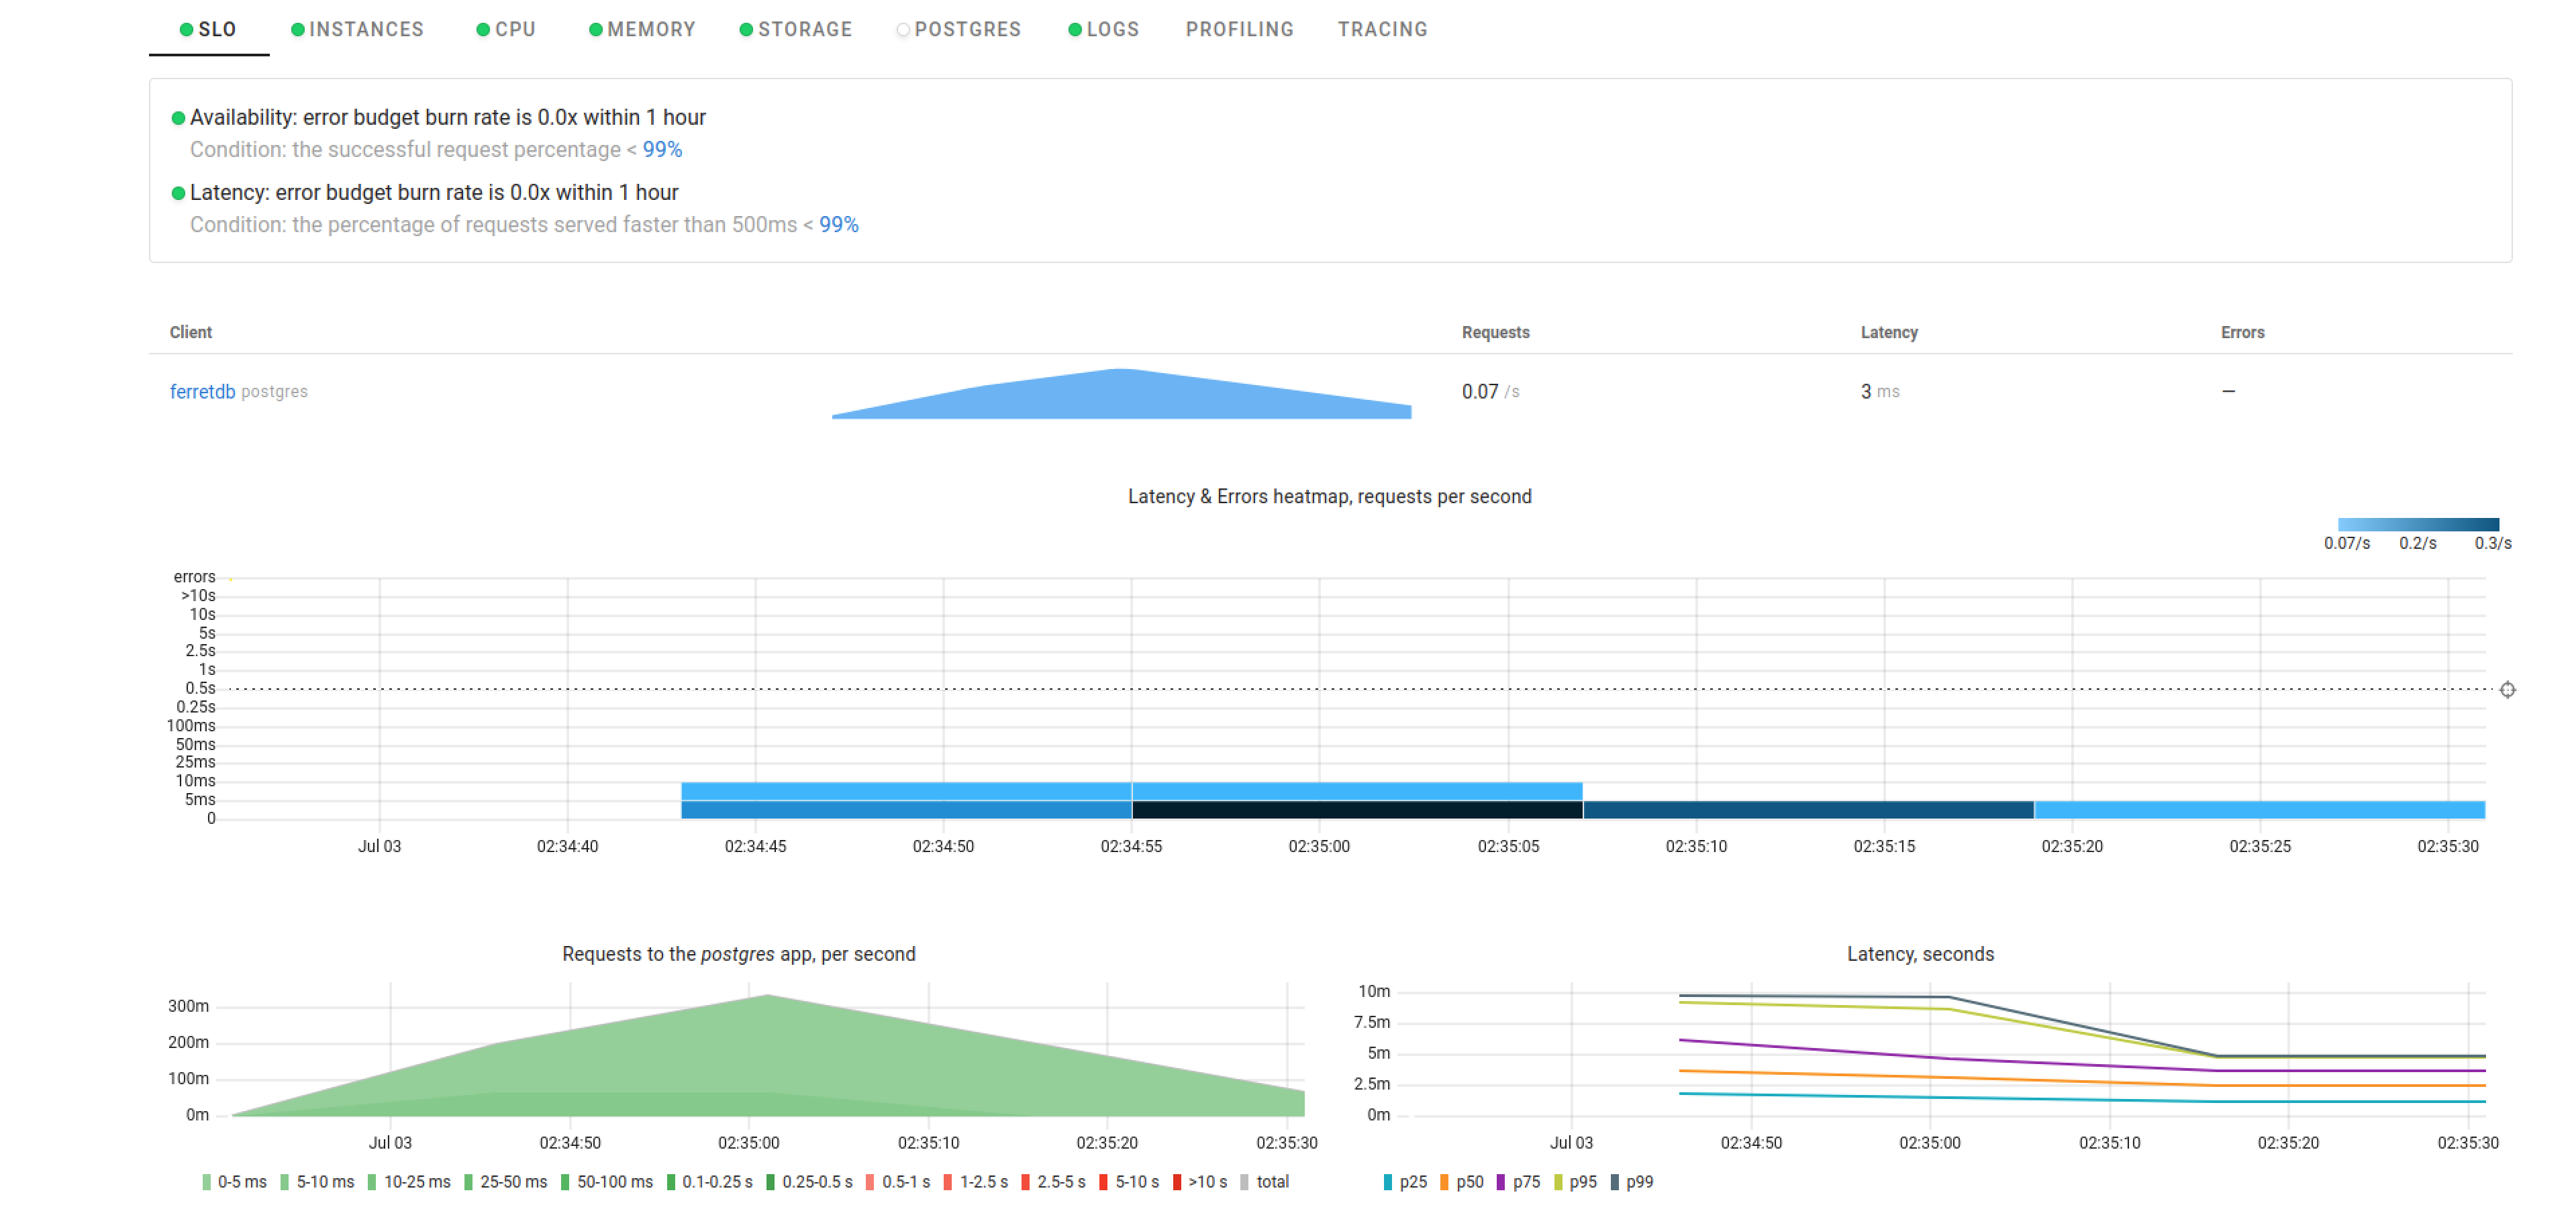
FerretDB forwards all requests to Postgres.
Since Coroot provides a comprehensive view of all services anyways, let's check out the postgres service to see how requests are handled, its performance, and what other insights we can learn from it.
Analyze and optimize FerretDB performance with Coroot
Coroot provides a comprehensive view of your entire system, including FerretDB and all its components. You can monitor and analyze performance metrics in real-time, identify bottlenecks, and optimize your system for better performance. It also includes predefined inspections of your system and its components, including SLO error rate/latency and notifications. You also get CPU, memory, storage, network, and log management metrics.
To get started with FerretDB, see our documentation. And if you want to contact the team for help or have any questions, contact us on any of our community channels.