Grafana Monitoring and Visualization for FerretDB

Monitoring and visualization tools play an essential role in overseeing the operations of a database, and Grafana is one of the most popular tools.
As the truly open-source alternative to MongoDB, FerretDB helps you remain in the open source ecosystem and avoid vendor lock-in. It also allows you to use the same commands and queries you're used to, along with many applications that MongoDB users already know.
In this regard, FerretDB is well suited to leverage the MongoDB data source plugin for Grafana.
This blog post will cover Grafana and how you can use it to analyze and monitor your FerretDB data.
What is Grafana?
Grafana is a comprehensive visualization and monitoring tool for managing and tracking data from multiple data sources such as MongoDB, PostgreSQL, and Prometheus, among others.
With insight into large data sets with complex infrastructures, Grafana provides you with configurable dashboards that you can use to tailor the different visualizations (or panels) for your data. Dashboards in Grafana consists of panels containing several views such as graph, table, and heatmap.
Besides this, Grafana offers many data source plugins – including the MongoDB plugin for Grafana – that can plug into your existing data. This gives you direct access to your data in real time and enables you to visualize and build dashboards for your contextual metrics.
And since there's a MongoDB plugin for Grafana, you can also set up Grafana to work with FerretDB databases, without any hassles.
What is FerretDB and How is it Different from MongoDB?
FerretDB is a open source document database alternative to MongoDB that converts MongoDB wire protocol queries to SQL, with PostgreSQL and SQLite (Beta version) as the backend.
By using FerretDB instead of MongoDB, you get the following benefits:
-
Open source: FerretDB is completely open source, released under the Apache 2.0 license – anyone can use it, modify it, and contribute to it. On the other hand, MongoDB is no longer open source after changing their license to Server side Public License (SSPL), which leaves room for different interpretation. For example, you may need to make your source code available if you provide MongoDB as a service. Also, the license does not allow you to embed MongoDB into your application. This is quite a huge concern for many open source users or early stage commercial companies; it was the motivation behind FerretDB – to ensure that MongoDB workloads can remain in the open source ecosystem.
-
No vendor lock-in: This is an added benefit of open source software. By using FerretDB, you can safely avoid vendor lock-in and remain in the open source ecosystem, without being worried about changing costs or requirements.
-
Backend ecosystem: For those familiar with database management for PostgreSQL or even SQLite (although still in beta stage), FerretDB is a great choice that enables them to scale and manage MongoDB workloads using their preferred management tools or resources.
-
Ease of use and compatibility with familiar tools: FerretDB is built to support the use of the same commands and queries language as MongoDB. In the same vein, FerretDB enables you to use most of the tools and applications as MongoDB, and this includes Grafana. Having Grafana monitoring for FerretDB enables users to easily track, analyze, and gain insights into their data through various visualization panels.
Let's jump in and take a look at how you can set up Grafana to monitor your FerretDB data!
How to Set Up Grafana Dashboards for your FerretDB data
Prerequisites
- Grafana Enterprise or Grafana Cloud (note that the MongoDB plugin for Grafana is only available for Grafana Enterprise and Grafana Cloud users)
- FerretDB connection URI
In this tutorial, we'll be making use of the FerretDB issues collection.
The issues is a compilation of the GitHub issues data derived from the FerretDB repository.
Each document within the collection corresponds to a specific issue with a direct URL to the issue on GitHub, including their current status, creation and closure dates, the author, assignees, and labels, among other details.
With this kind of data collection, we can visualize comprehensive statistics and metrics using Grafana, which could offer critical insights into potential process improvements, performance over time, backlog management, and also make informed decisions for future milestones.
The advantages are endless!
Here's a sample view of a document in the issues collection:
{
  _id: ObjectId('64b7e557921f991a8697d6fd'),
  number: 179,
  url: 'https://github.com/FerretDB/FerretDB/issues/179',
  title: 'Support field types validation',
  state: 'OPEN',
  stateReason: '',
  createdAt: ISODate('2021-12-14T18:13:01.000Z'),
  closedAt: null,
  labels: ['code/feature', 'not ready'],
  milestone: '',
  author: 'AlekSi',
  assignees: [],
  typename: 'Issue'
}
How to connect Grafana with FerretDB
This section of the tutorial assumes that you have Grafana Enterprise or Grafana Cloud and have your FerretDB Connection URI.
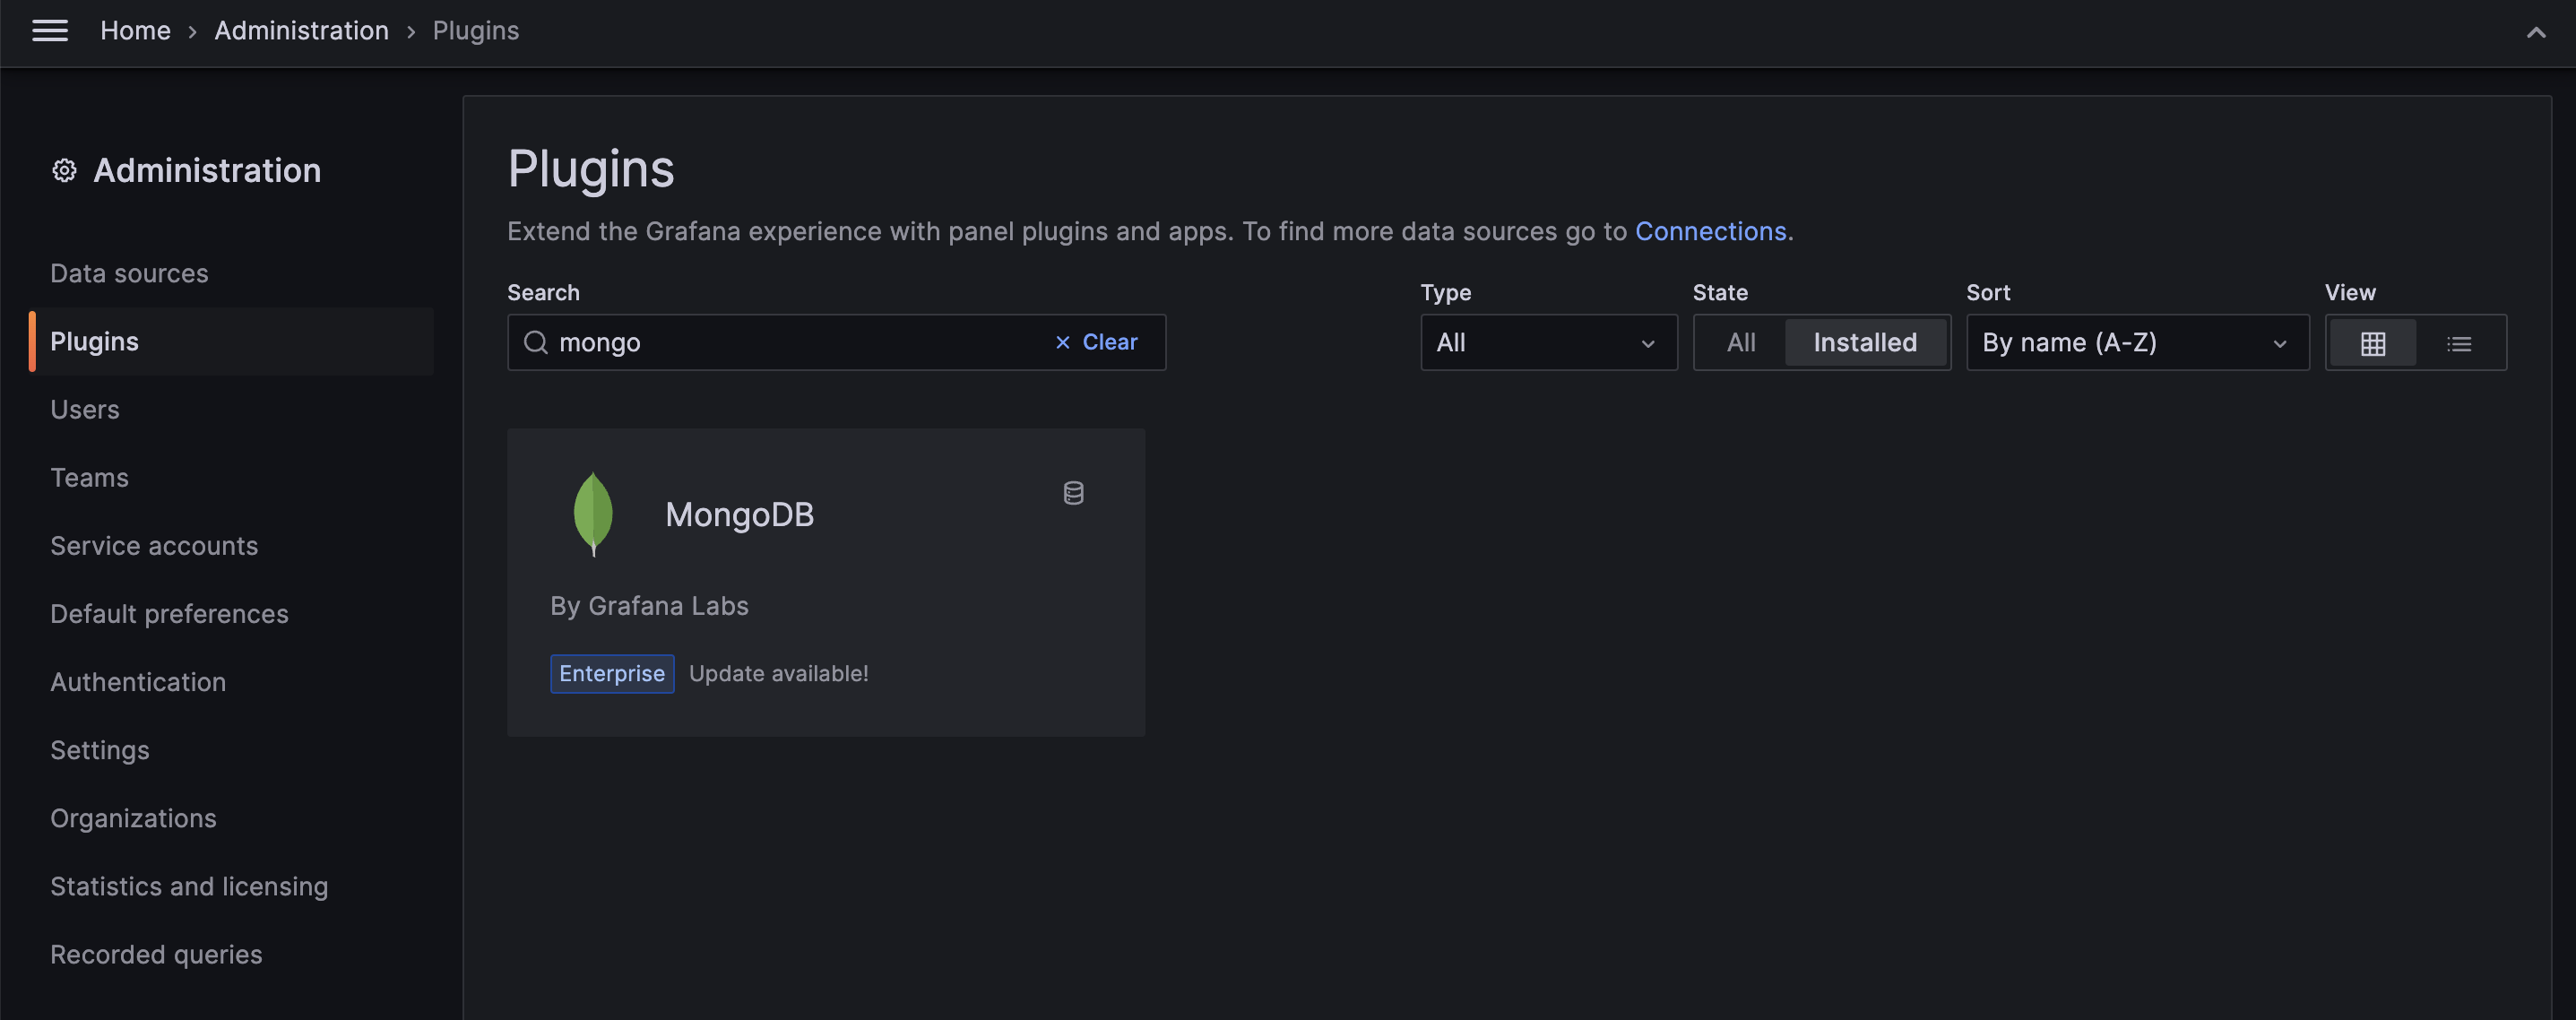
Once you're signed in, go to the navigation section; under "Administration", select "Plugins" to download the MongoDB plugin for Grafana.
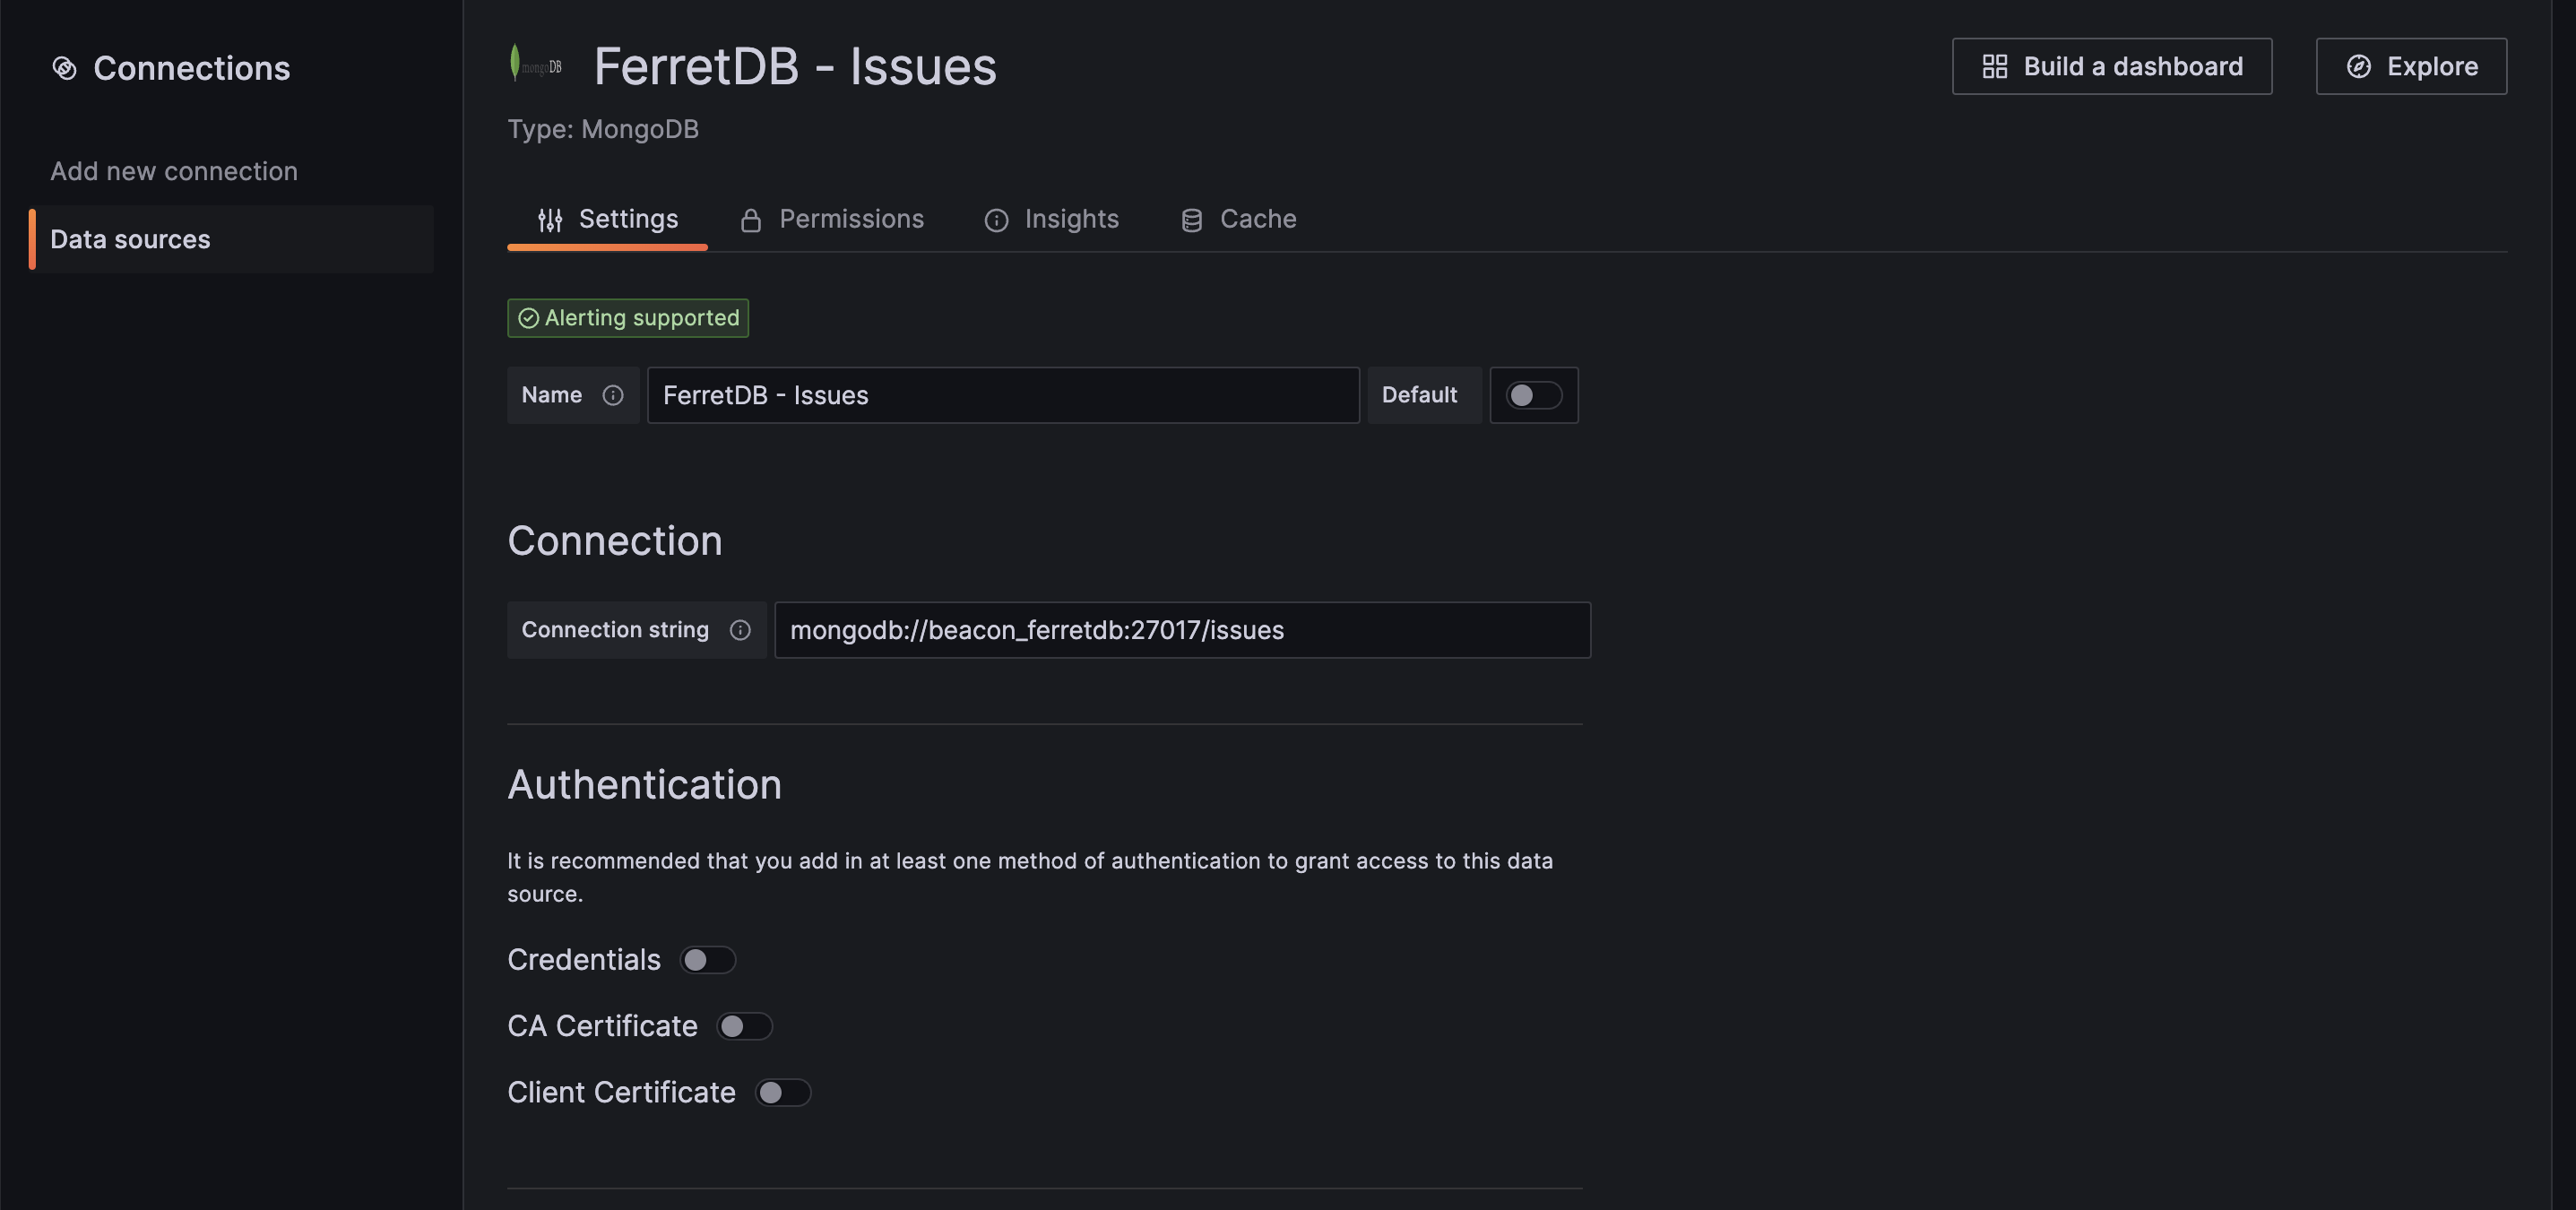
After installing the plugin, go to "Connections", select "Data sources" and add the connection string URI and authentication credentials to connect to the FerretDB database.
Through Grafana, we will visualize and analyze the issues collection data and gain insight into our entire process, scale of work, and performance over time.
We'll also create several panels on the dashboard.
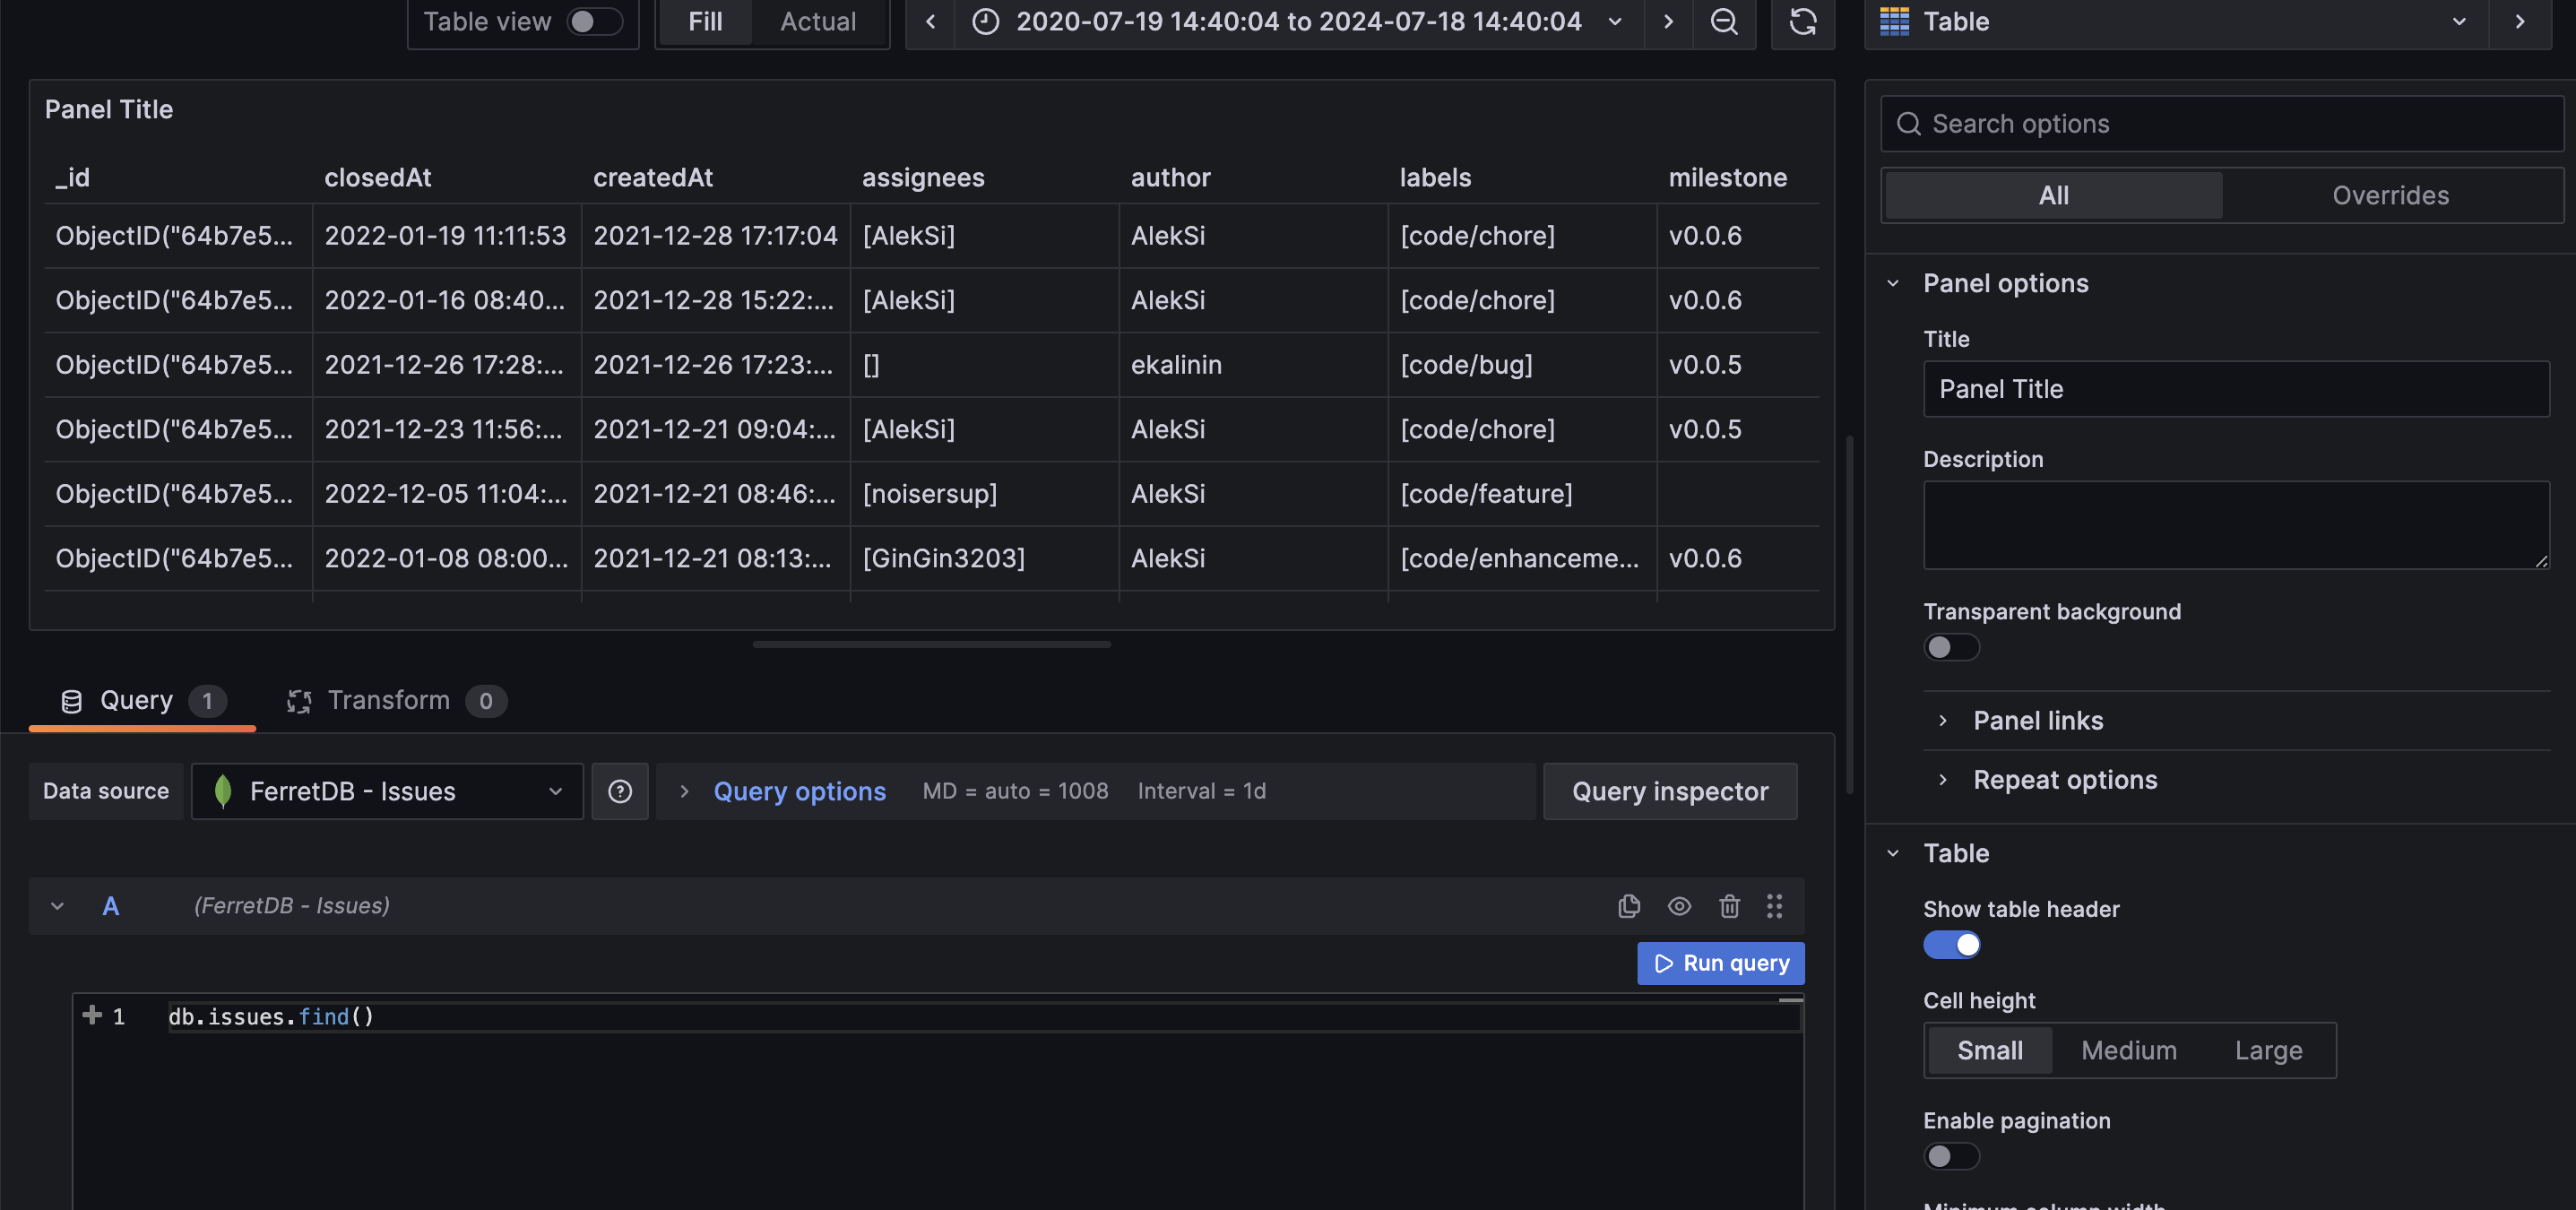
On the Grafana dashboard, you need to select the right data source; here we will select the FerretDB - Issues data source and then can run db.issues.find() in the query tab to check that everything works as expected, and we have our data ready.
Then we can change the visualization to a table to see the list of all documents in a clearer view.
Now that the data is visible in Grafana, let's further scrutinize the data and gain some granular insight from it.
Panel 1: Total number of issues in the last 10 milestones
First, we want to know the number of issues the team worked on leading to each of the milestones (release). To do this, we'll be using the following aggregation pipeline operation, and setting the visualization in Grafana as bar chart:
db.issues.aggregate([
  {
    $match: {
      milestone: { $ne: ['', 'Next'] }
    }
  },
  {
    $group: {
      _id: '$milestone',
      count: { $sum: 1 }
    }
  },
  { $sort: { _id: -1 } },
  { $limit: 10 }
])
To start, it will filter out the issues with an empty "milestone" value or not labeled as "Next". Then it groups these selected issues based on their milestones. For each group, we calculate the number of issues per milestone and store their result in "count".
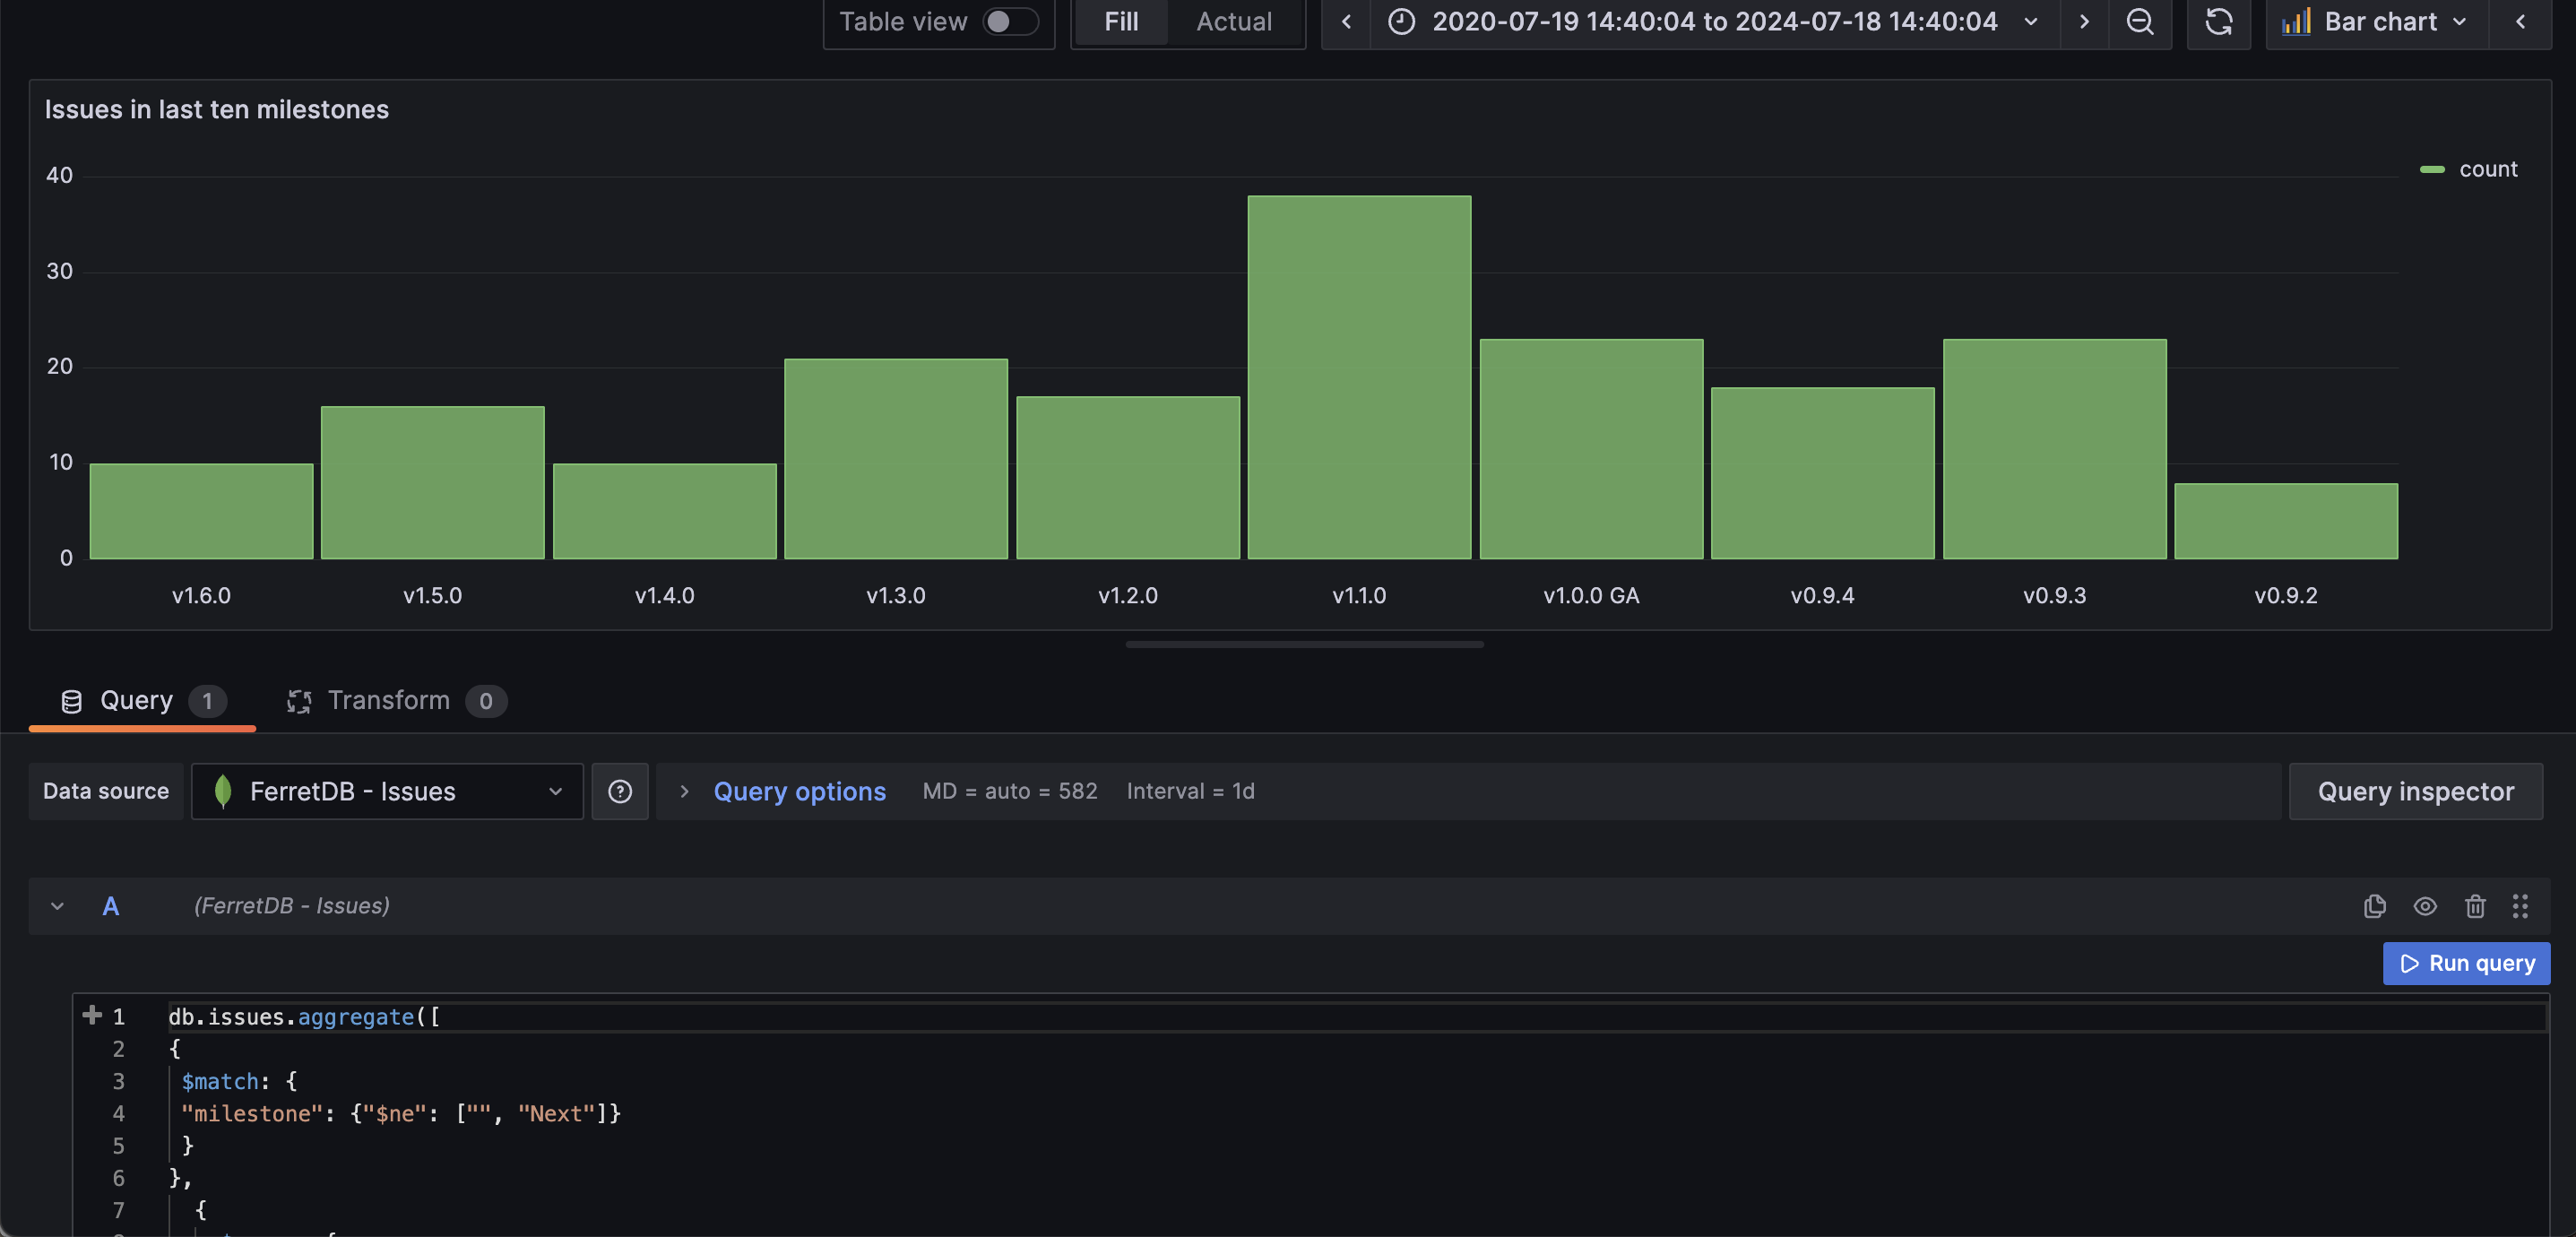
Instantly, through the chart, we can see that there were 38 issues leading up to the "milestone" of v1.1.0, compared to just 8 for v0.9.2.
Brilliant, right? Just like that we've already gleaned insight into the total number of issues per milestone.
Panel 2: Total number of issues marked as "not ready"
The next thing we want to know is the total number of issues that are marked as "not ready" and we'll be using the gauge visualization for this.
The query for this operation is:
db.issues.aggregate([
  { $match: { state: 'OPEN' } },
  { $unwind: '$labels' },
  { $match: { labels: { $eq: 'not ready' } } },
  { $group: { _id: '$labels', count: { $sum: 1 } } }
])
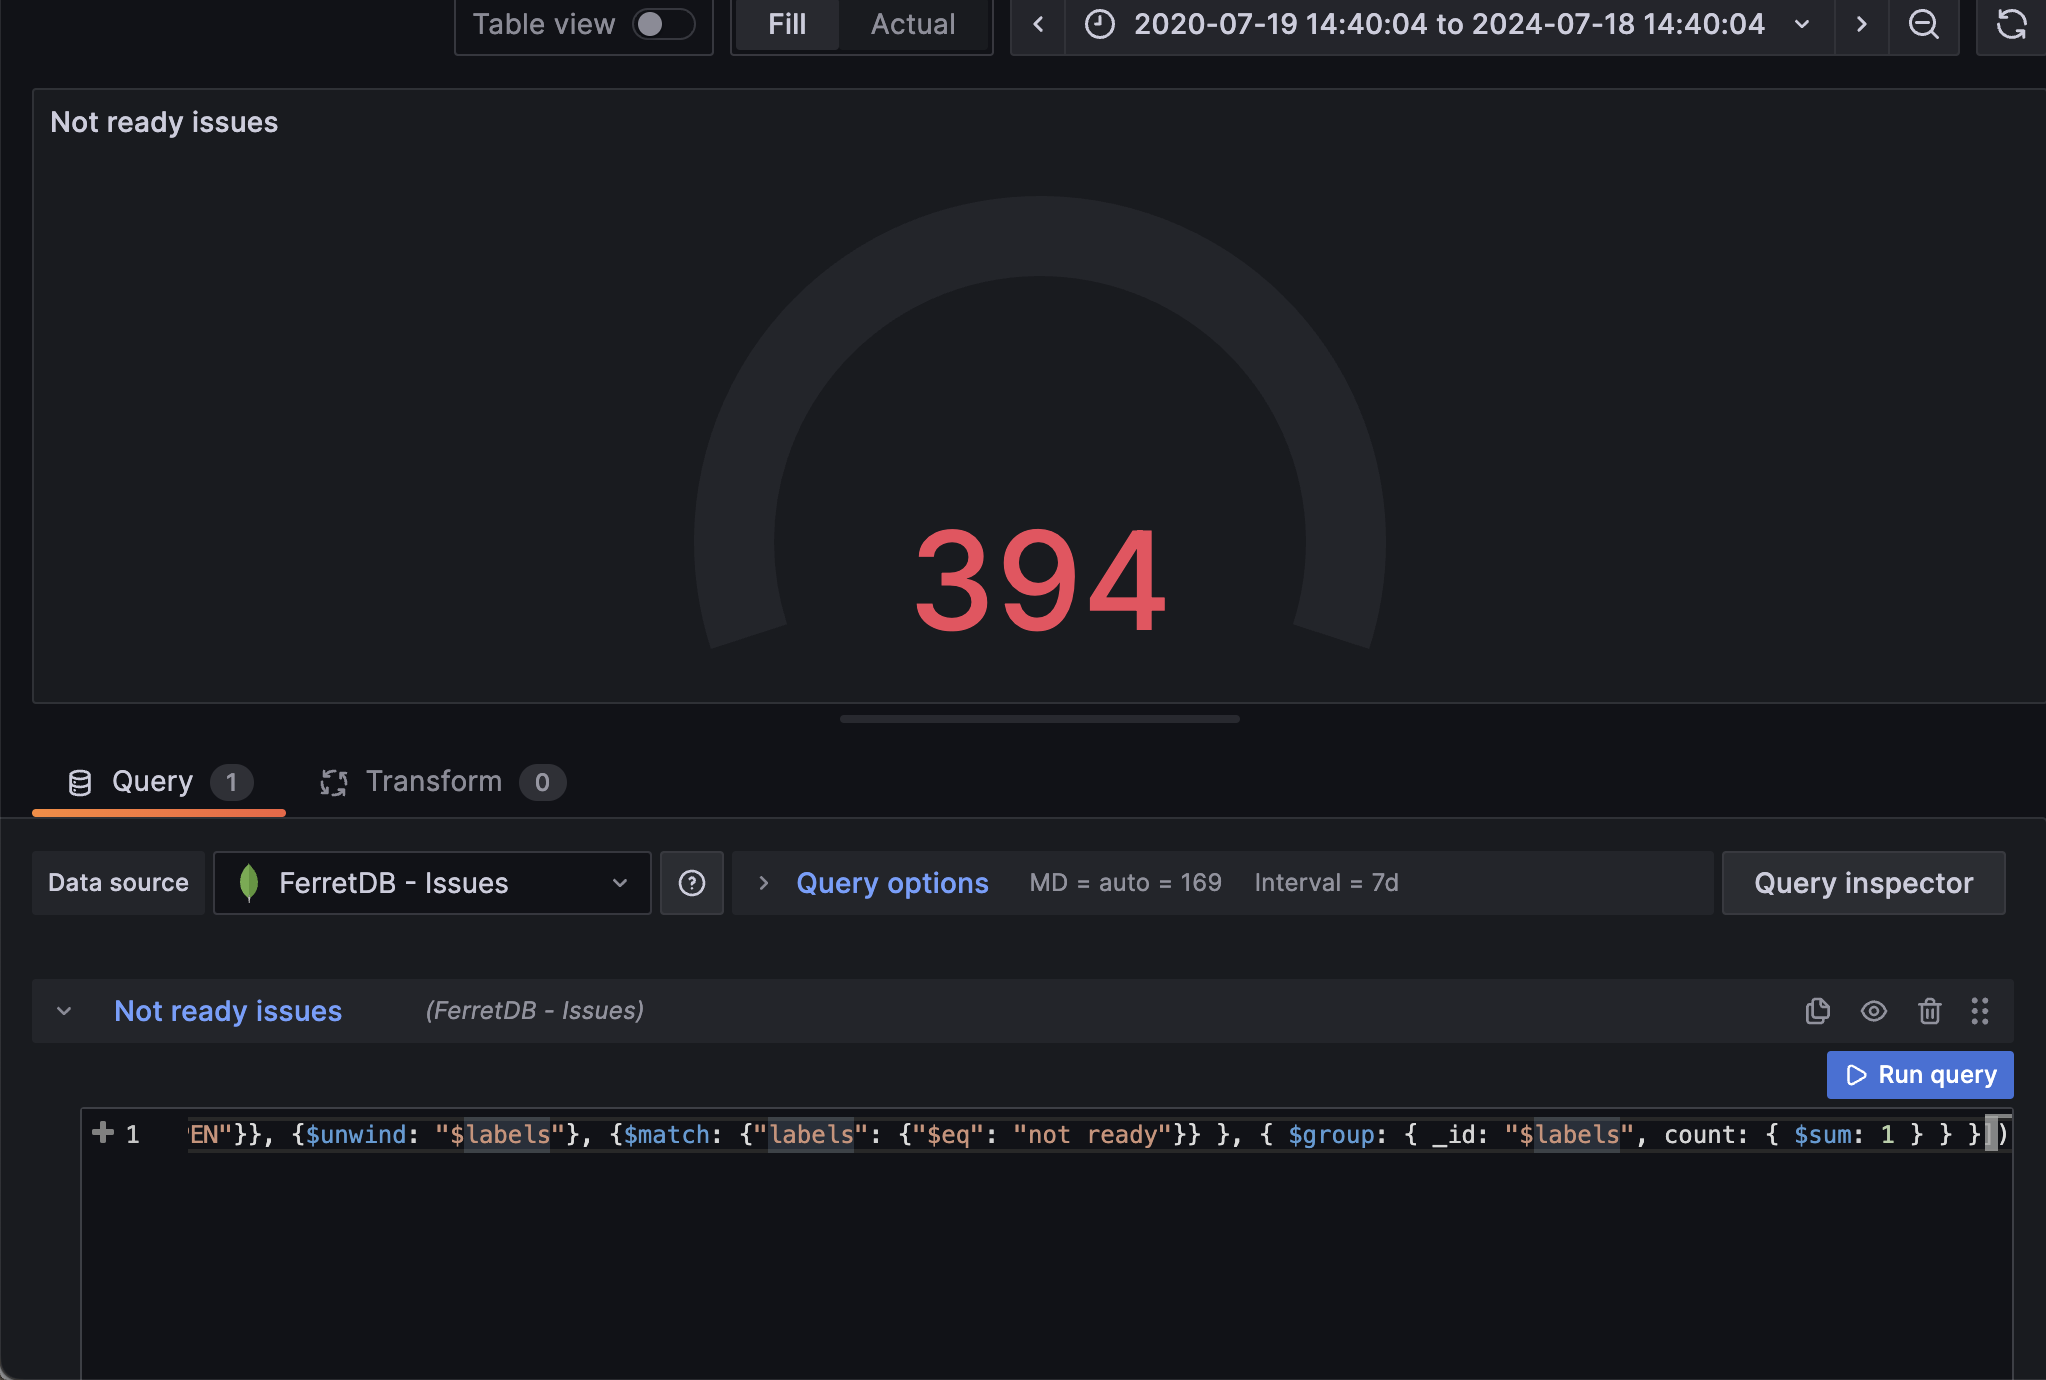
As we've seen in the image, we can track the total number of OPEN issues that are not yet ready to be worked on, and this could shed light on the current backlog.
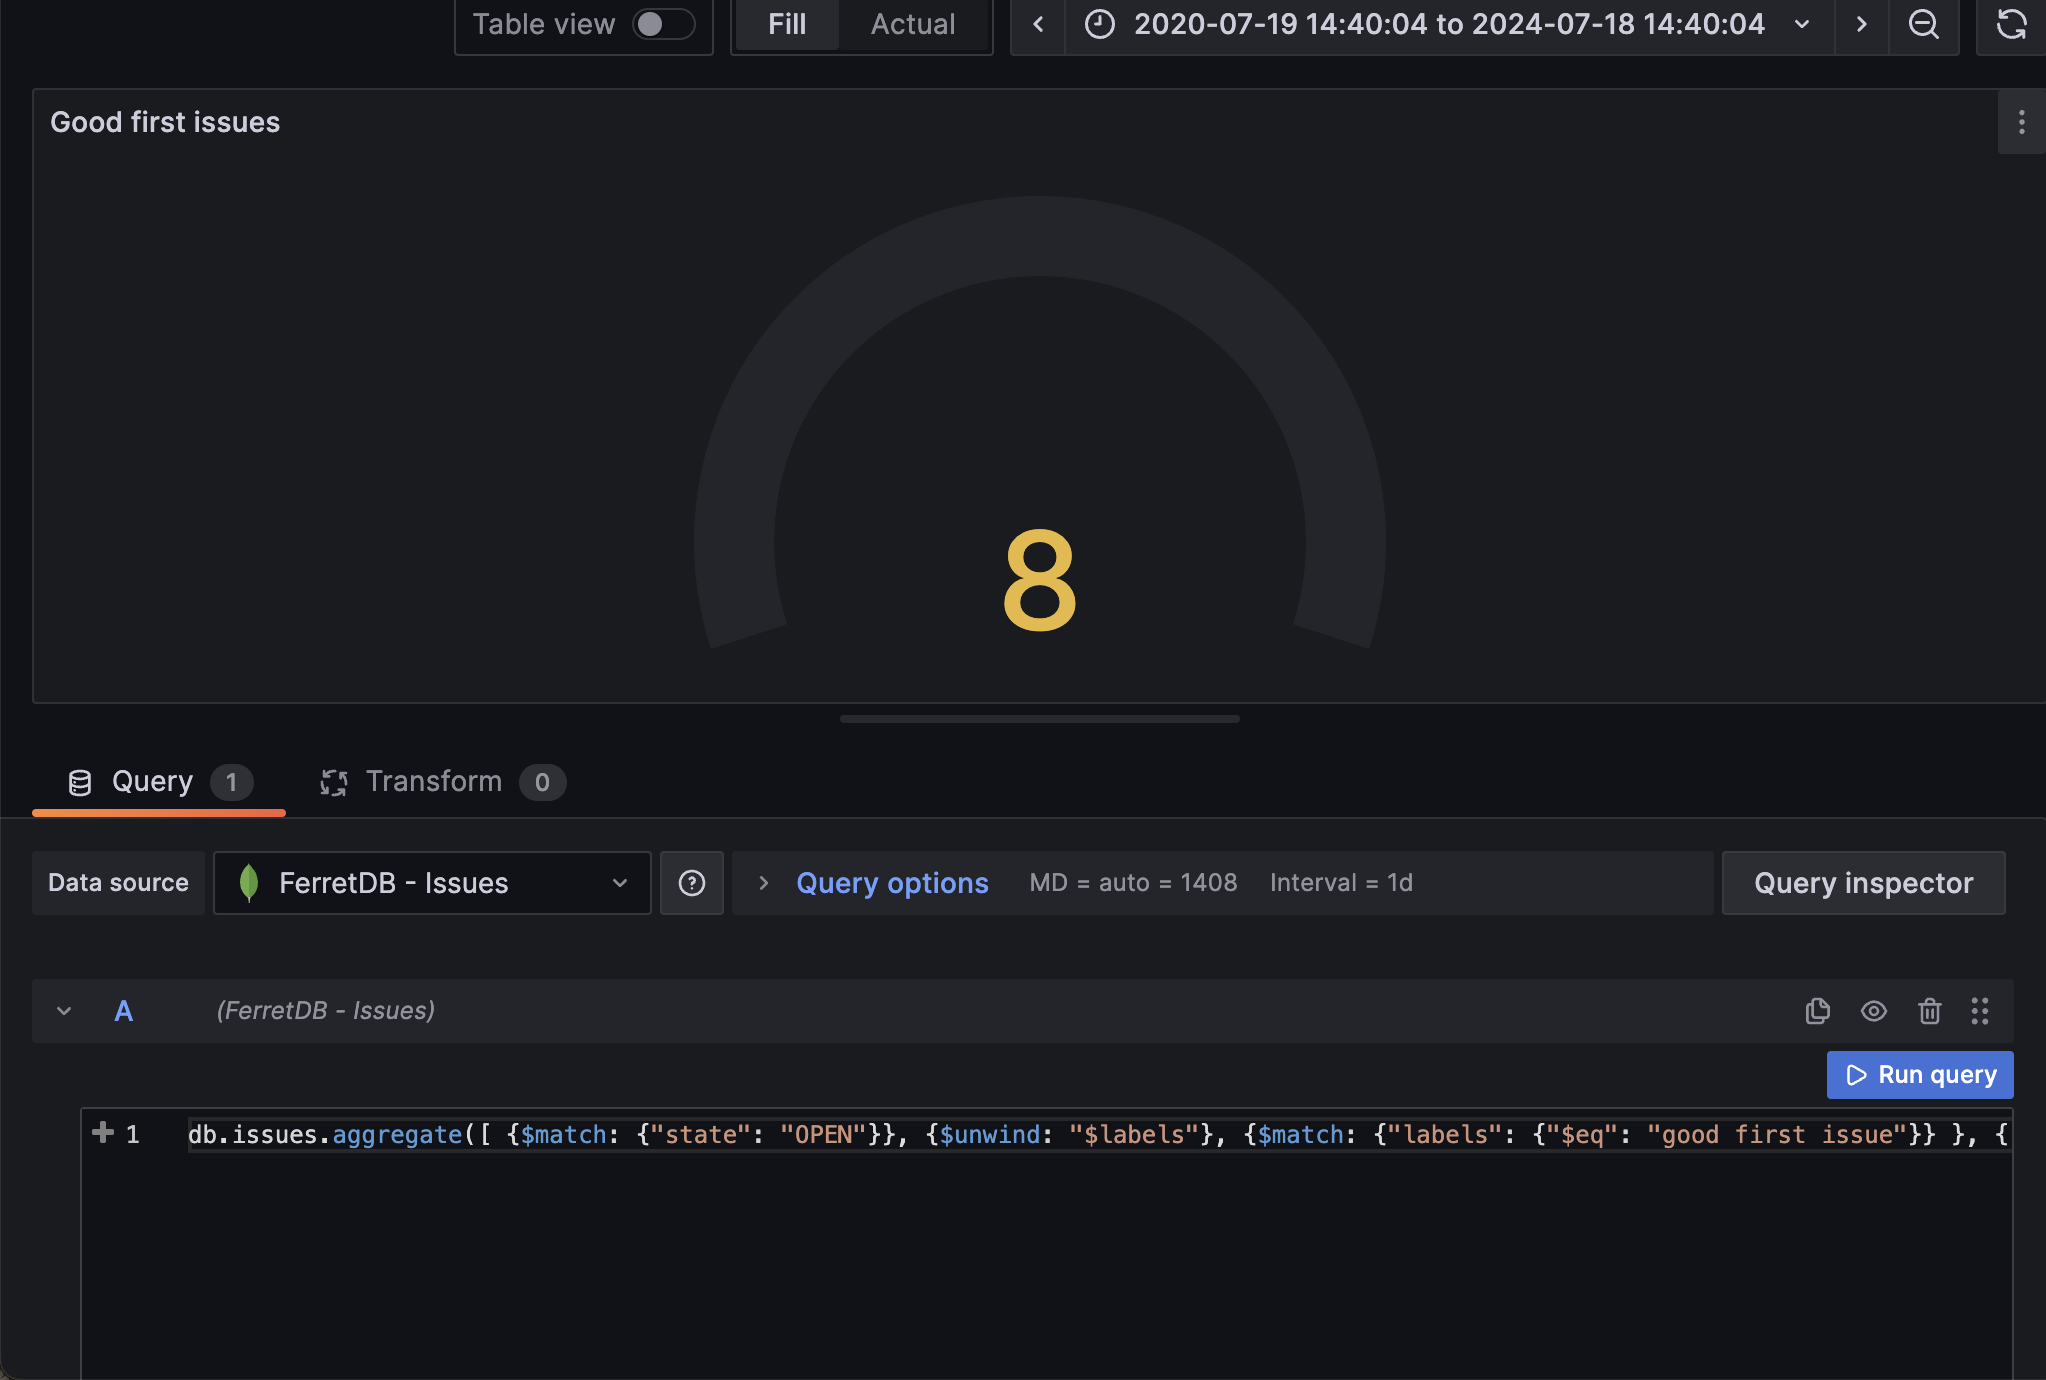
Panel 3: Total number of "good first issue"
To make it easier for first time contributors, having a decent number of "good first issue" can be tremendously vital to their open source contribution.
The aggregation operation for generating this visualization will group all OPEN issues, and then unwind the labels array so we can work directly with the elements in the array; then we match, group, and count all labels with "good first issue".
db.issues.aggregate([
  { $match: { state: 'OPEN' } },
  { $unwind: '$labels' },
  { $match: { labels: { $eq: 'good first issue' } } },
  { $group: { _id: '$labels', count: { $sum: 1 } } }
])
Similar to the previous panel, we'll be using the gauge visualization to show the total number of "good first issues"
Panel 4: Group all issues by their state
Here, we want group all the issues by their state and set the visualization as a pie chart.
db.issues.aggregate([
  {
    $group: {
      _id: '$state',
      count: { $sum: 1 }
    }
  }
])
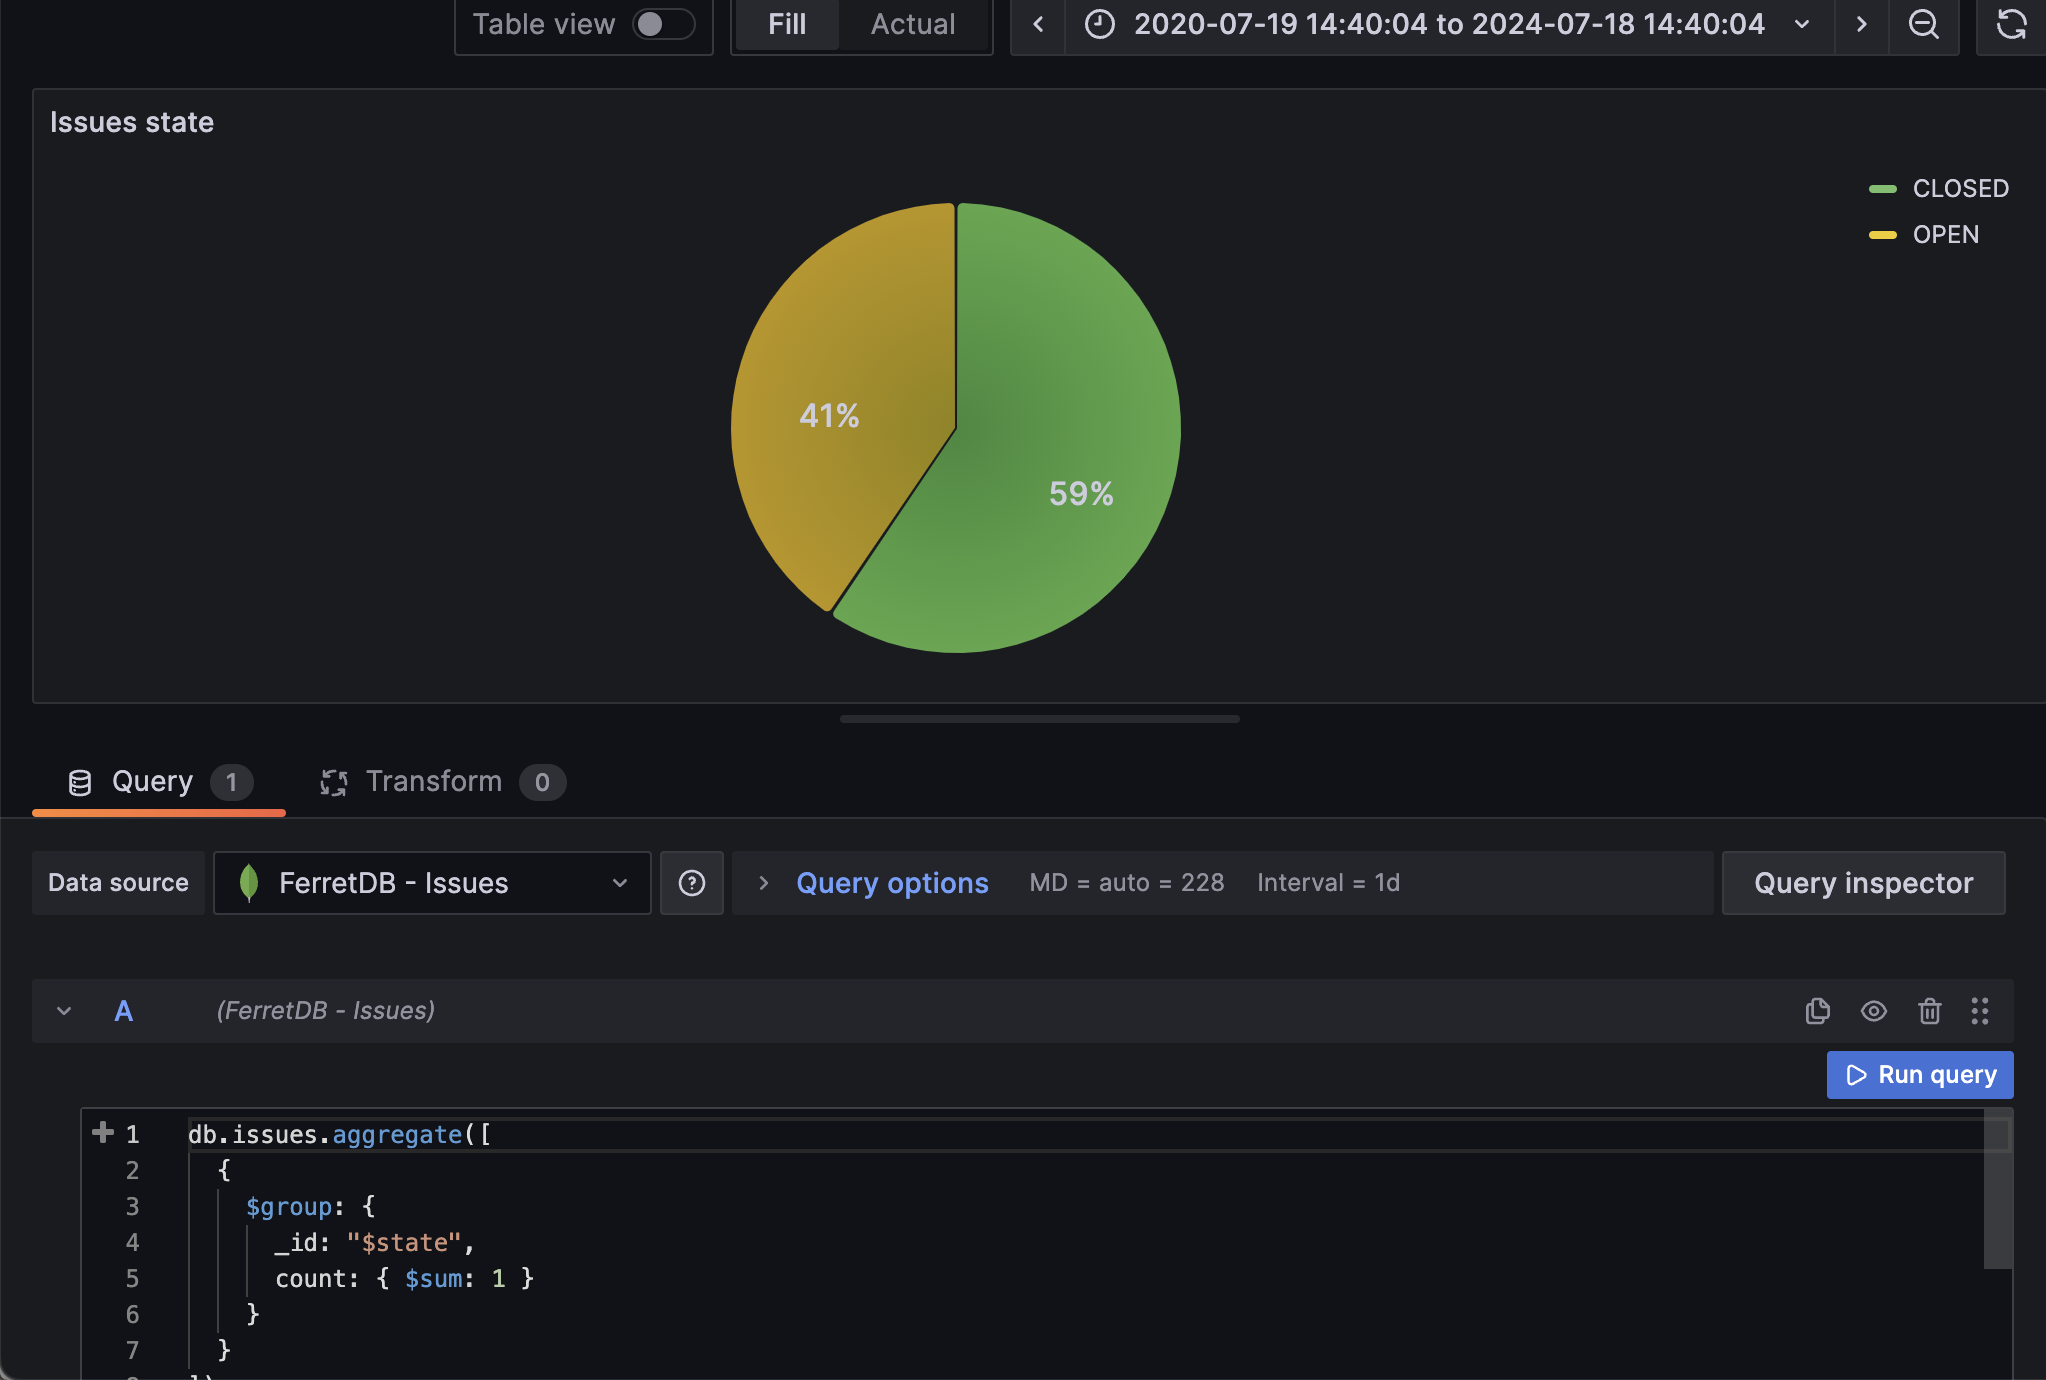
In the pie chart, we can instantly see all the percentage of open issues vs closed issues.
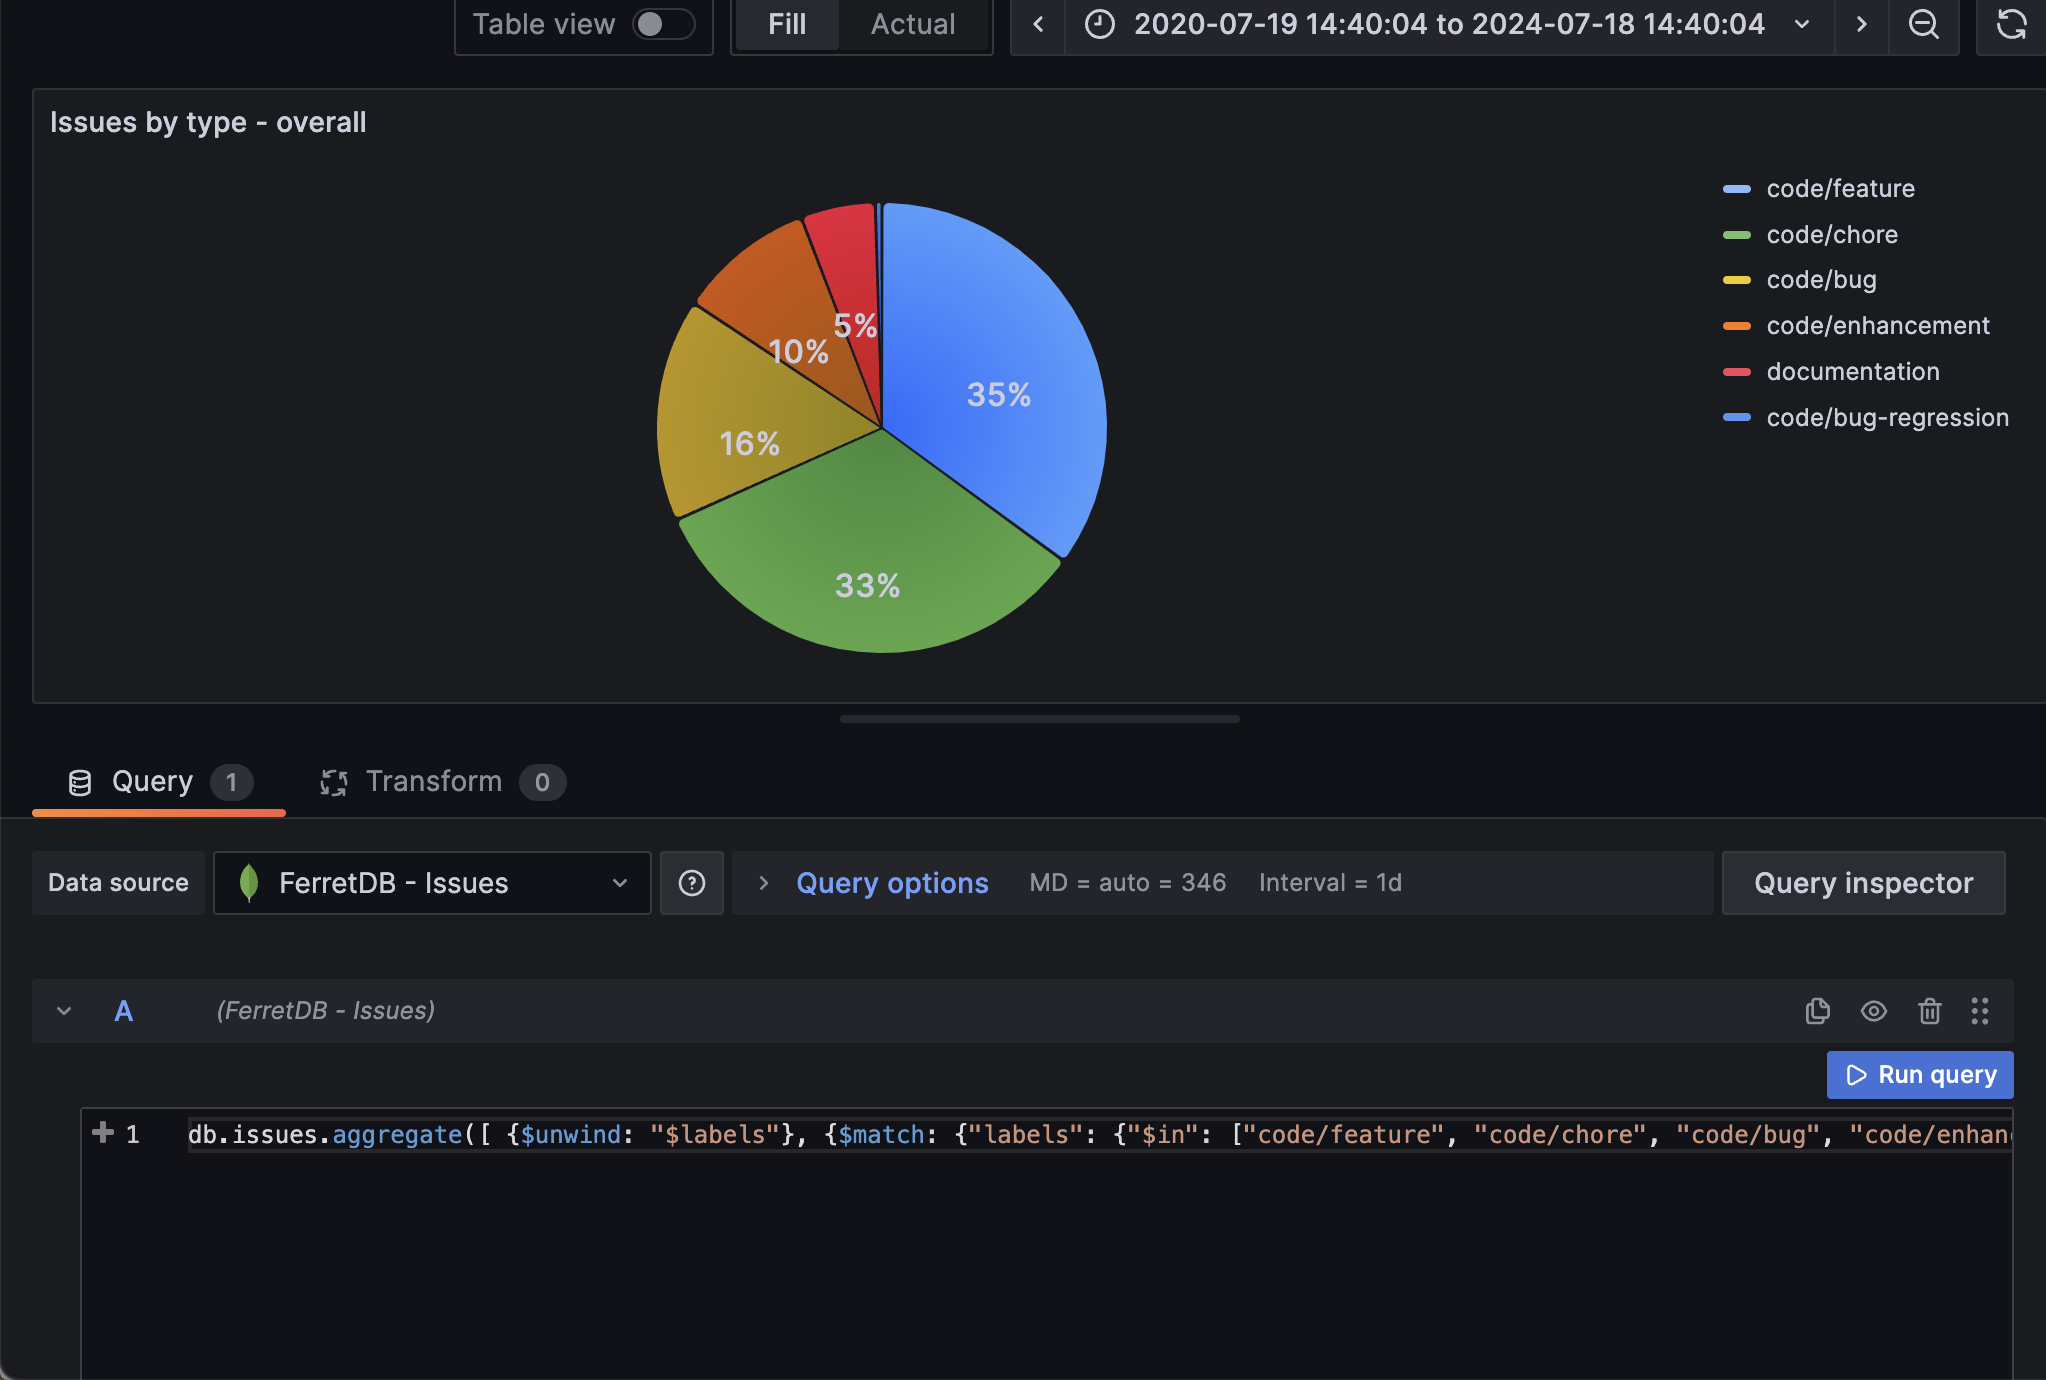
Panel 5: Group all issues by labels
We can also group all the issues by their different labels. Since the labels are in array, we will need to unwind the array elements and group them into their separate labels.
db.issues.aggregate([
  { $unwind: '$labels' },
  {
    $match: {
      labels: {
        $in: [
          'code/feature',
          'code/chore',
          'code/bug',
          'code/enhancement',
          'code/bug-regression',
          'documentation'
        ]
      }
    }
  },
  { $group: { _id: '$labels', count: { $sum: 1 } } }
])
On Grafana, we will use the pie chart visualization to showcase the labels
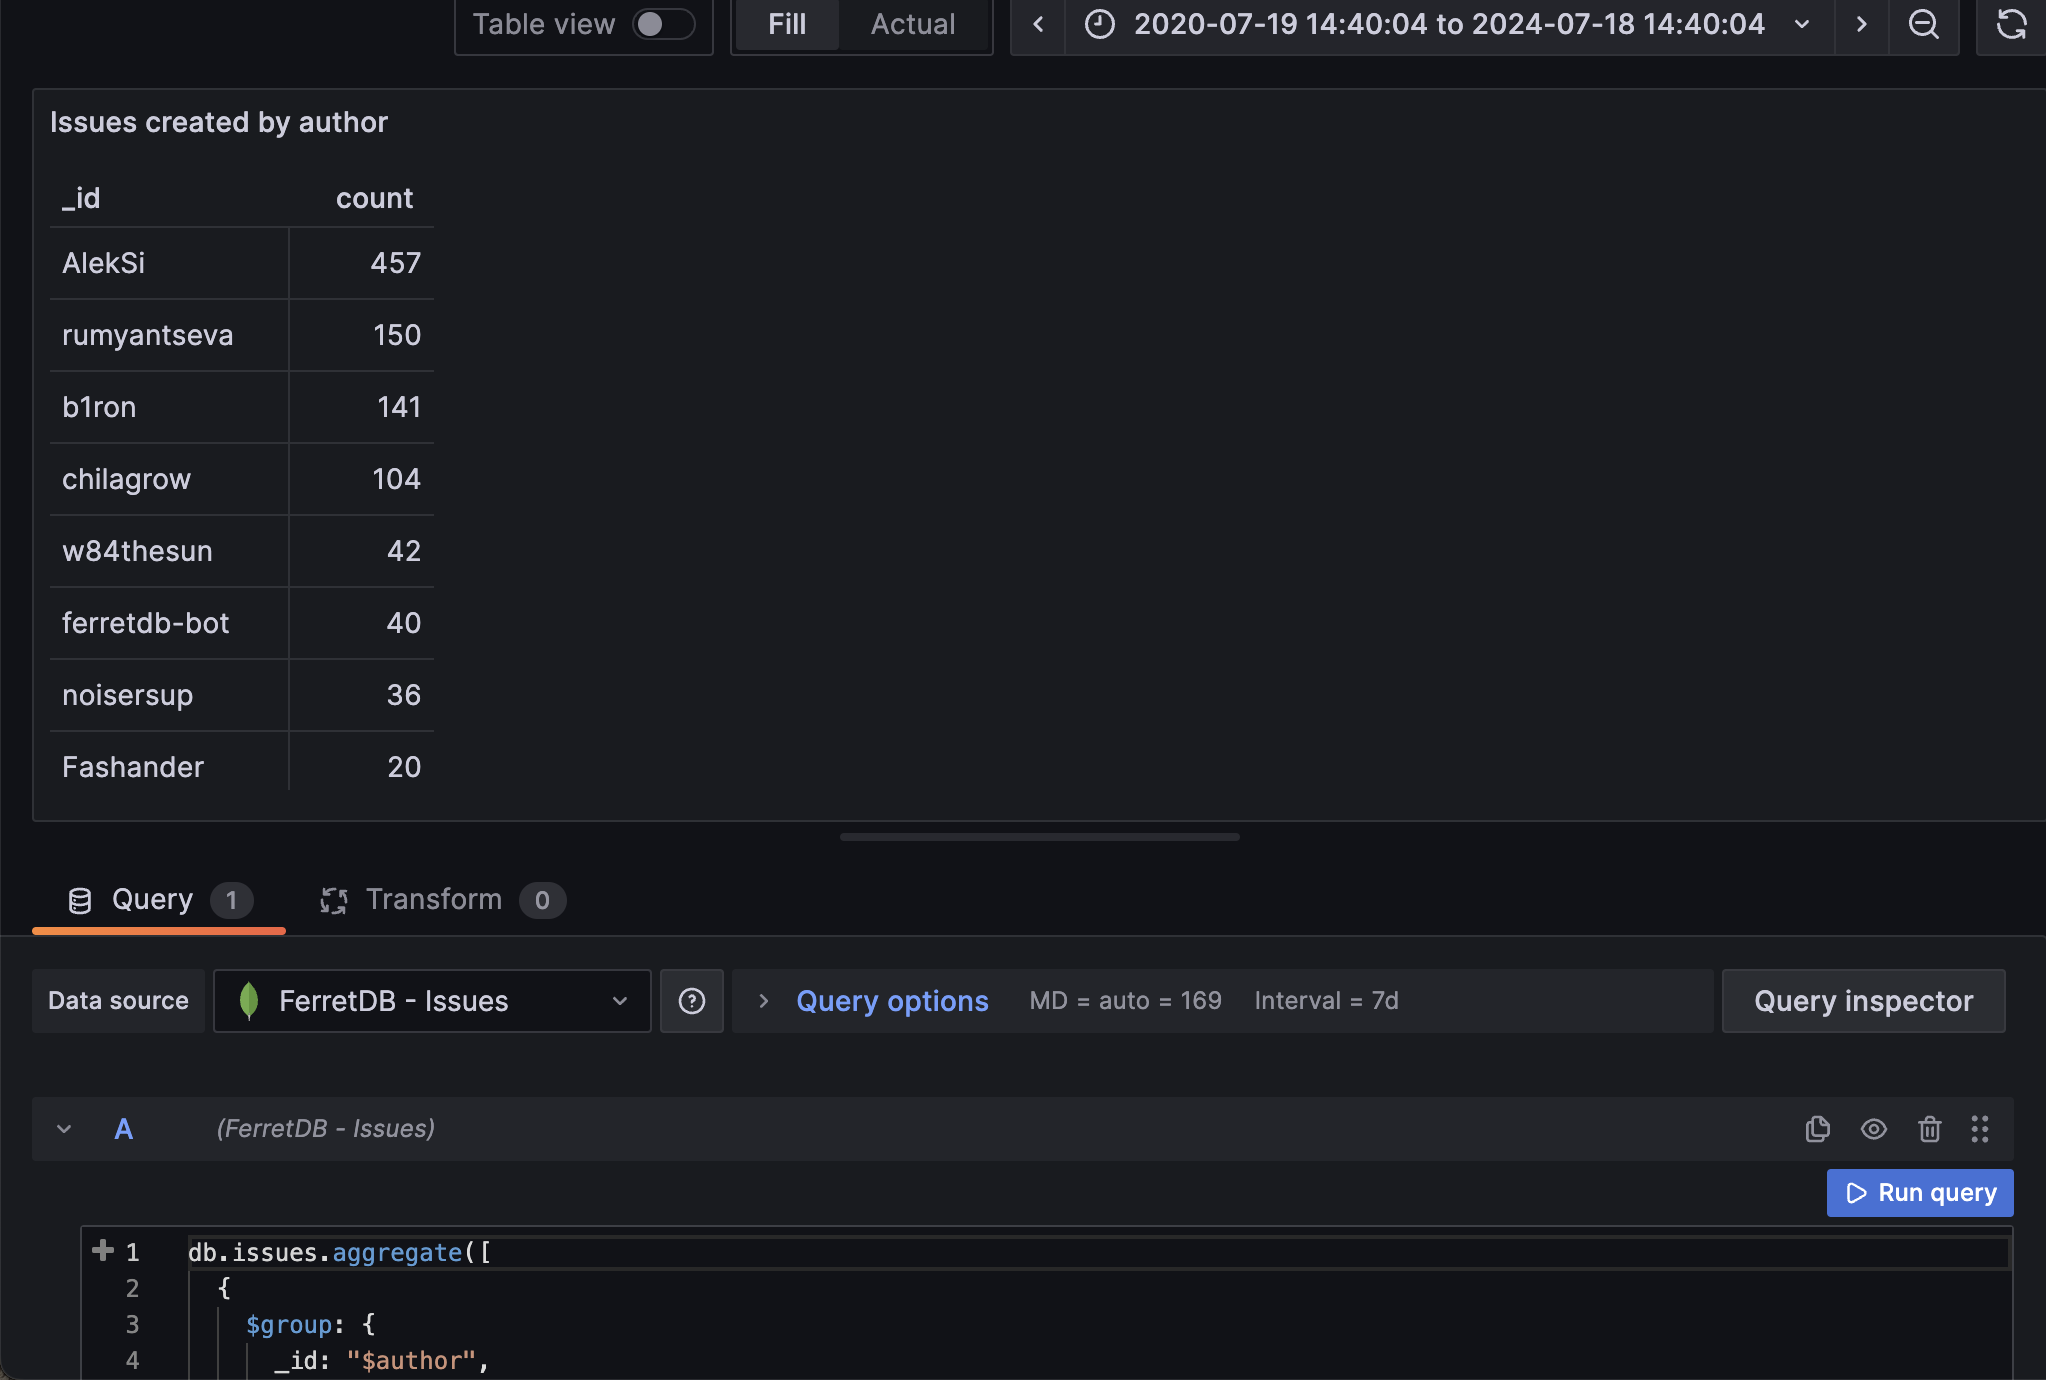
Panel 6: Total number of issues created by authors
In this panel, we want to group and count all issues by "author" and sort them from highest count to the lowest. The aggregation operation to use in the query:
db.issues.aggregate([
  {
    $group: {
      _id: '$author',
      count: { $sum: 1 }
    }
  },
  {
    $sort: { count: -1 }
  },
  {
    $limit: 8
  }
])
We can then set the visualization to be a table.
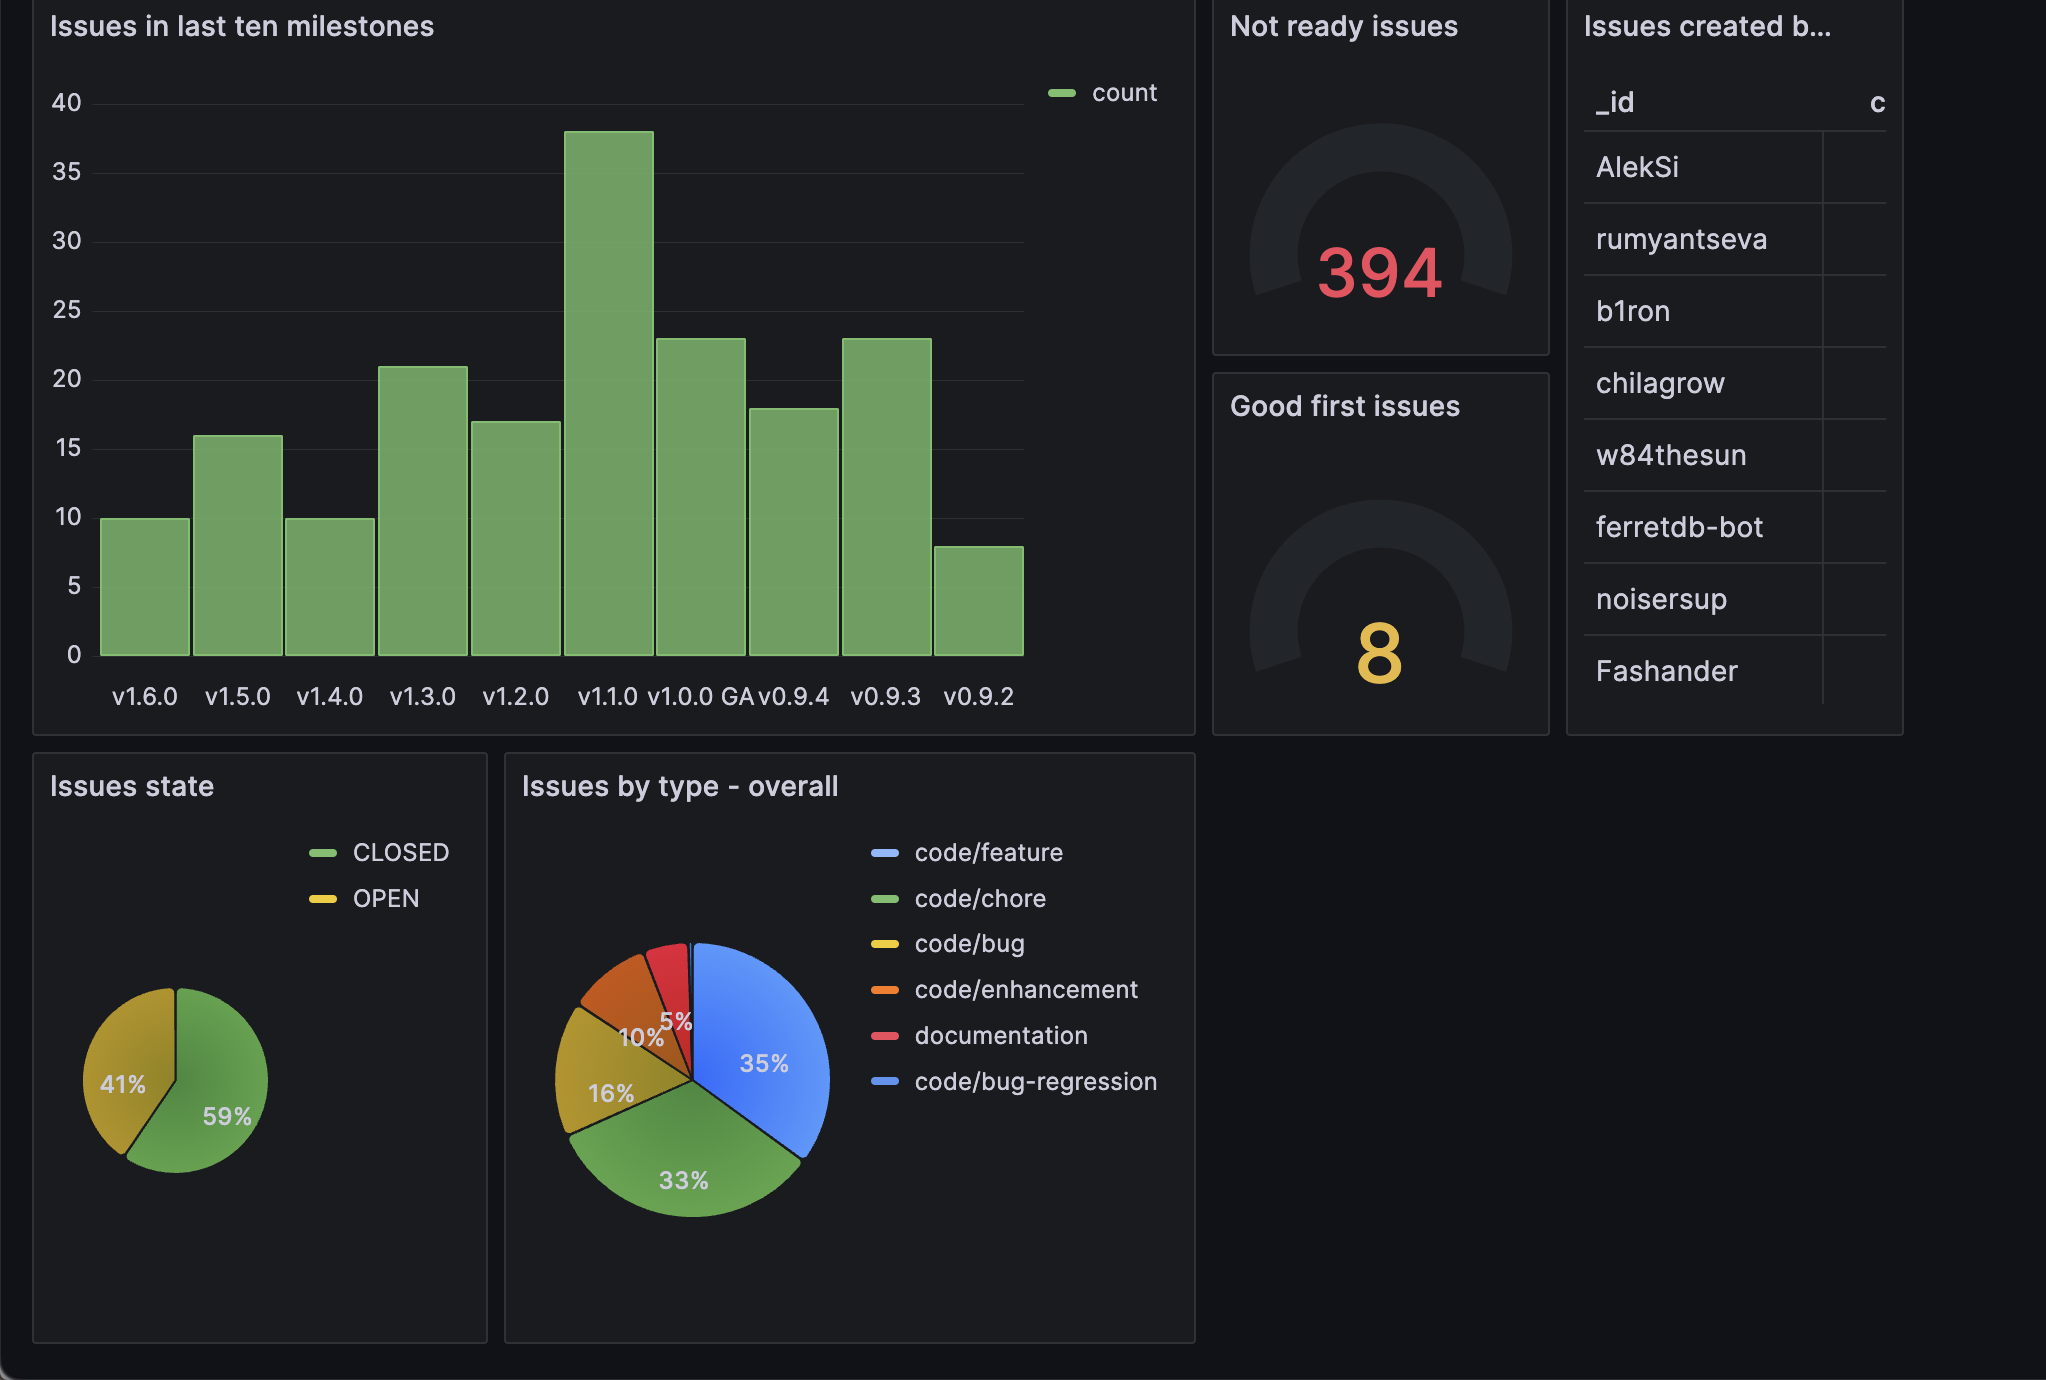
Below, we can see all of these panels in one dashboard.
Start Monitoring FerretDB Data with Grafana
So far, we have explored how you can seamlessly integrate Grafana with FerretDB using the Grafana MongoDB plugin. With a user-friendly dashboard and several informative panels, Grafana enables you to visualize data and gain insights into the current state of your database.
Of course, there's so much more that we can do with Grafana monitoring and FerretDB, and the examples in this blog post only gives you a glimpse of what's possible, and we can't wait to see what you come up with.
Check out our installation guide to get started.