FerretDB releases v1.23.0 with improved observability

We are happy to announce the release of FerretDB v1.23.0 with new features and improvements to enhance observability and debugging.
This FerretDB release introduces support for OpenTelemetry tracing, Kubernetes liveness and readiness probes, improved logging formats, and integrated health checks for Docker and the addition of an experimental systemd unit file.
The new features should provide deeper insights into your database operations, so you can easily monitor, debug, and manage your FerretDB instances.
Read on to learn more.
Embeddable package
This release switches from the zap logging package to the standard slog.
If the logger was configured by Go programs that import FerretDB package, they should configure the SLogger field instead.
Setting the old Logger field will make the program panic and make the issue immediately noticeable.
Please note that the next release will completely remove zap and rename SLogger to just Logger.
Initial OpenTelemetry tracing support
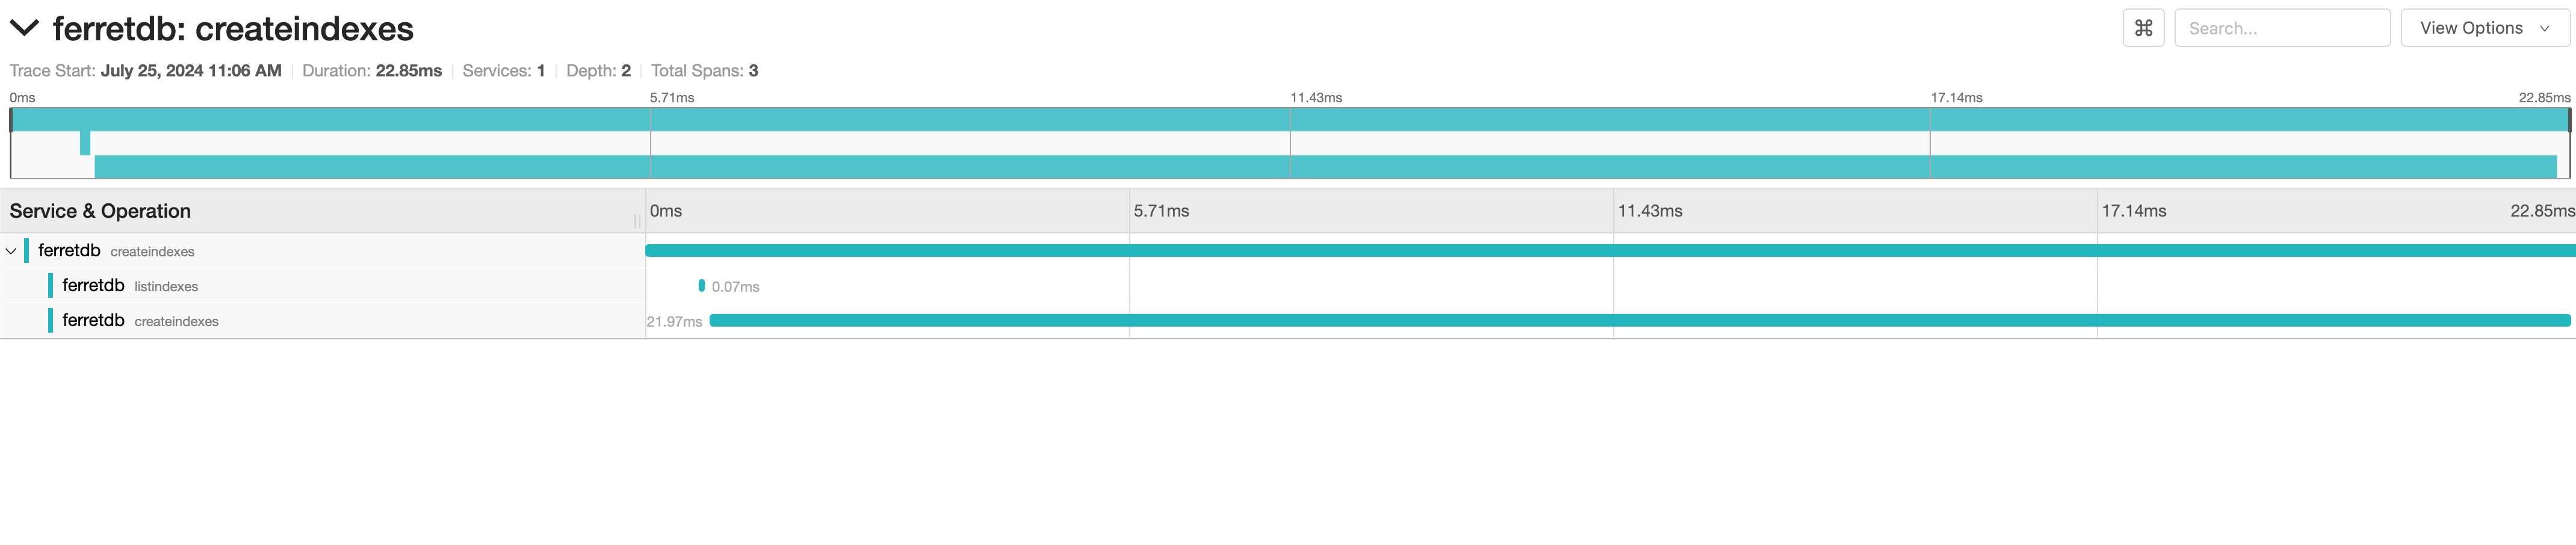
One of the major additions in this release is the initial support for OpenTelemetry (OTel) tracing.
This feature allows FerretDB to send traces to the specified HTTP/OTLP URL endpoint.
To enable OpenTelemetry traces, you can use the --otel-traces-url flag to specify the OTLP/HTTP traces endpoint URL (e.g. --otel-traces-url=http://<host>:4318/v1/traces).
Alternatively, you can set the FERRETDB_OTEL_TRACES_URL environment variable to the desired endpoint URL.
The trace format is not stable yet; attribute names and values might change over time.
Kubernetes liveness and readiness probes and other observability improvements
FerretDB now supports Kubernetes liveness and readiness probes that you can use to monitor the health of FerretDB instances in a Kubernetes environment.
The liveness probe endpoint is /debug/livez while the readiness probe endpoint is /debug/readyz.
Similarly, all Docker images now include a HEALTHCHECK instruction that behaves like a readiness probe, so that the Docker container is only considered healthy when FerretDB is ready to handle connections.
In adddition to that, we have introduced a new debug handler at /debug/archive to improve observability.
This handler self-scrapes Prometheus metrics via /debug/metrics, captures a binary memory pprof profile via /debug/pprof/heap, and finally packages the collected data into a .zip archive and streams it to the client with a proper content-disposition header.
We intend to expand this feature with additional parameters and files in future updates.
Please find the documentation for all improvements in observability in this release (OpenTelemetry traces, Kubernetes probes, debug archive) here.
Experimental systemd configuration in .deb and .rpm packages
FerretDB now includes a systemd unit file in its .deb and .rpm packages.
This release adds initial unit files for systemd that auto-start FerretDB.
Please note that there is a possibility that they will change in the future in an incompatible way; for example, we may switch to using a non-root user.
Other updates
We updated our documentation to include information on logging, Kubernetes probes, and OpenTelemetry tracing with clearer guidelines on how to configure and use them.
For a complete list of all changes in this release, please see our FerretDB v1.23 release Changelog.
Our appreciation also goes out to open source community, our users, and all our contributors, especially @PaveenV who made their first contribution to FerretDB.
With the addition of OpenTelemetry tracing, Kubernetes probes, improved logging, and more, FerretDB users can now gain better observability and control over their database environments.
As we continue to improve FerretDB's observability features, we're eager to hear from our users. Your insights, suggestions, and questions are invaluable in guiding our development efforts.
What specific aspects of observability would you like to see improved? Are there particular metrics, tracing capabilities, or logging features that would make your experience better? We want to know your thoughts and ideas. Please feel free to reach out on any of our channels here.